IONS - Episodic Pivot - 2025-07-30
IONS Trade Summary
Performance metrics and trade details for IONS breakout.
- Stage
- 2
- Catalyst
- Earnings Report
- Risk
- 2.4%
- Gain %
- -2.4%
- Market Condition
- Choppy
- Market Cap
- $6.6B
- Shares Float
- 155.28M
- Entry
- ORB
- Stop
- LoD
- Exit
- Stopped Out
- Reward Risk Ratio
- -1.0R
- About
Ionis Pharmaceuticals turned profitable for the first time with 256% YoY earnings growth, 101% revenue growth, and massive surprises: +868% EPS and +52% revenue.
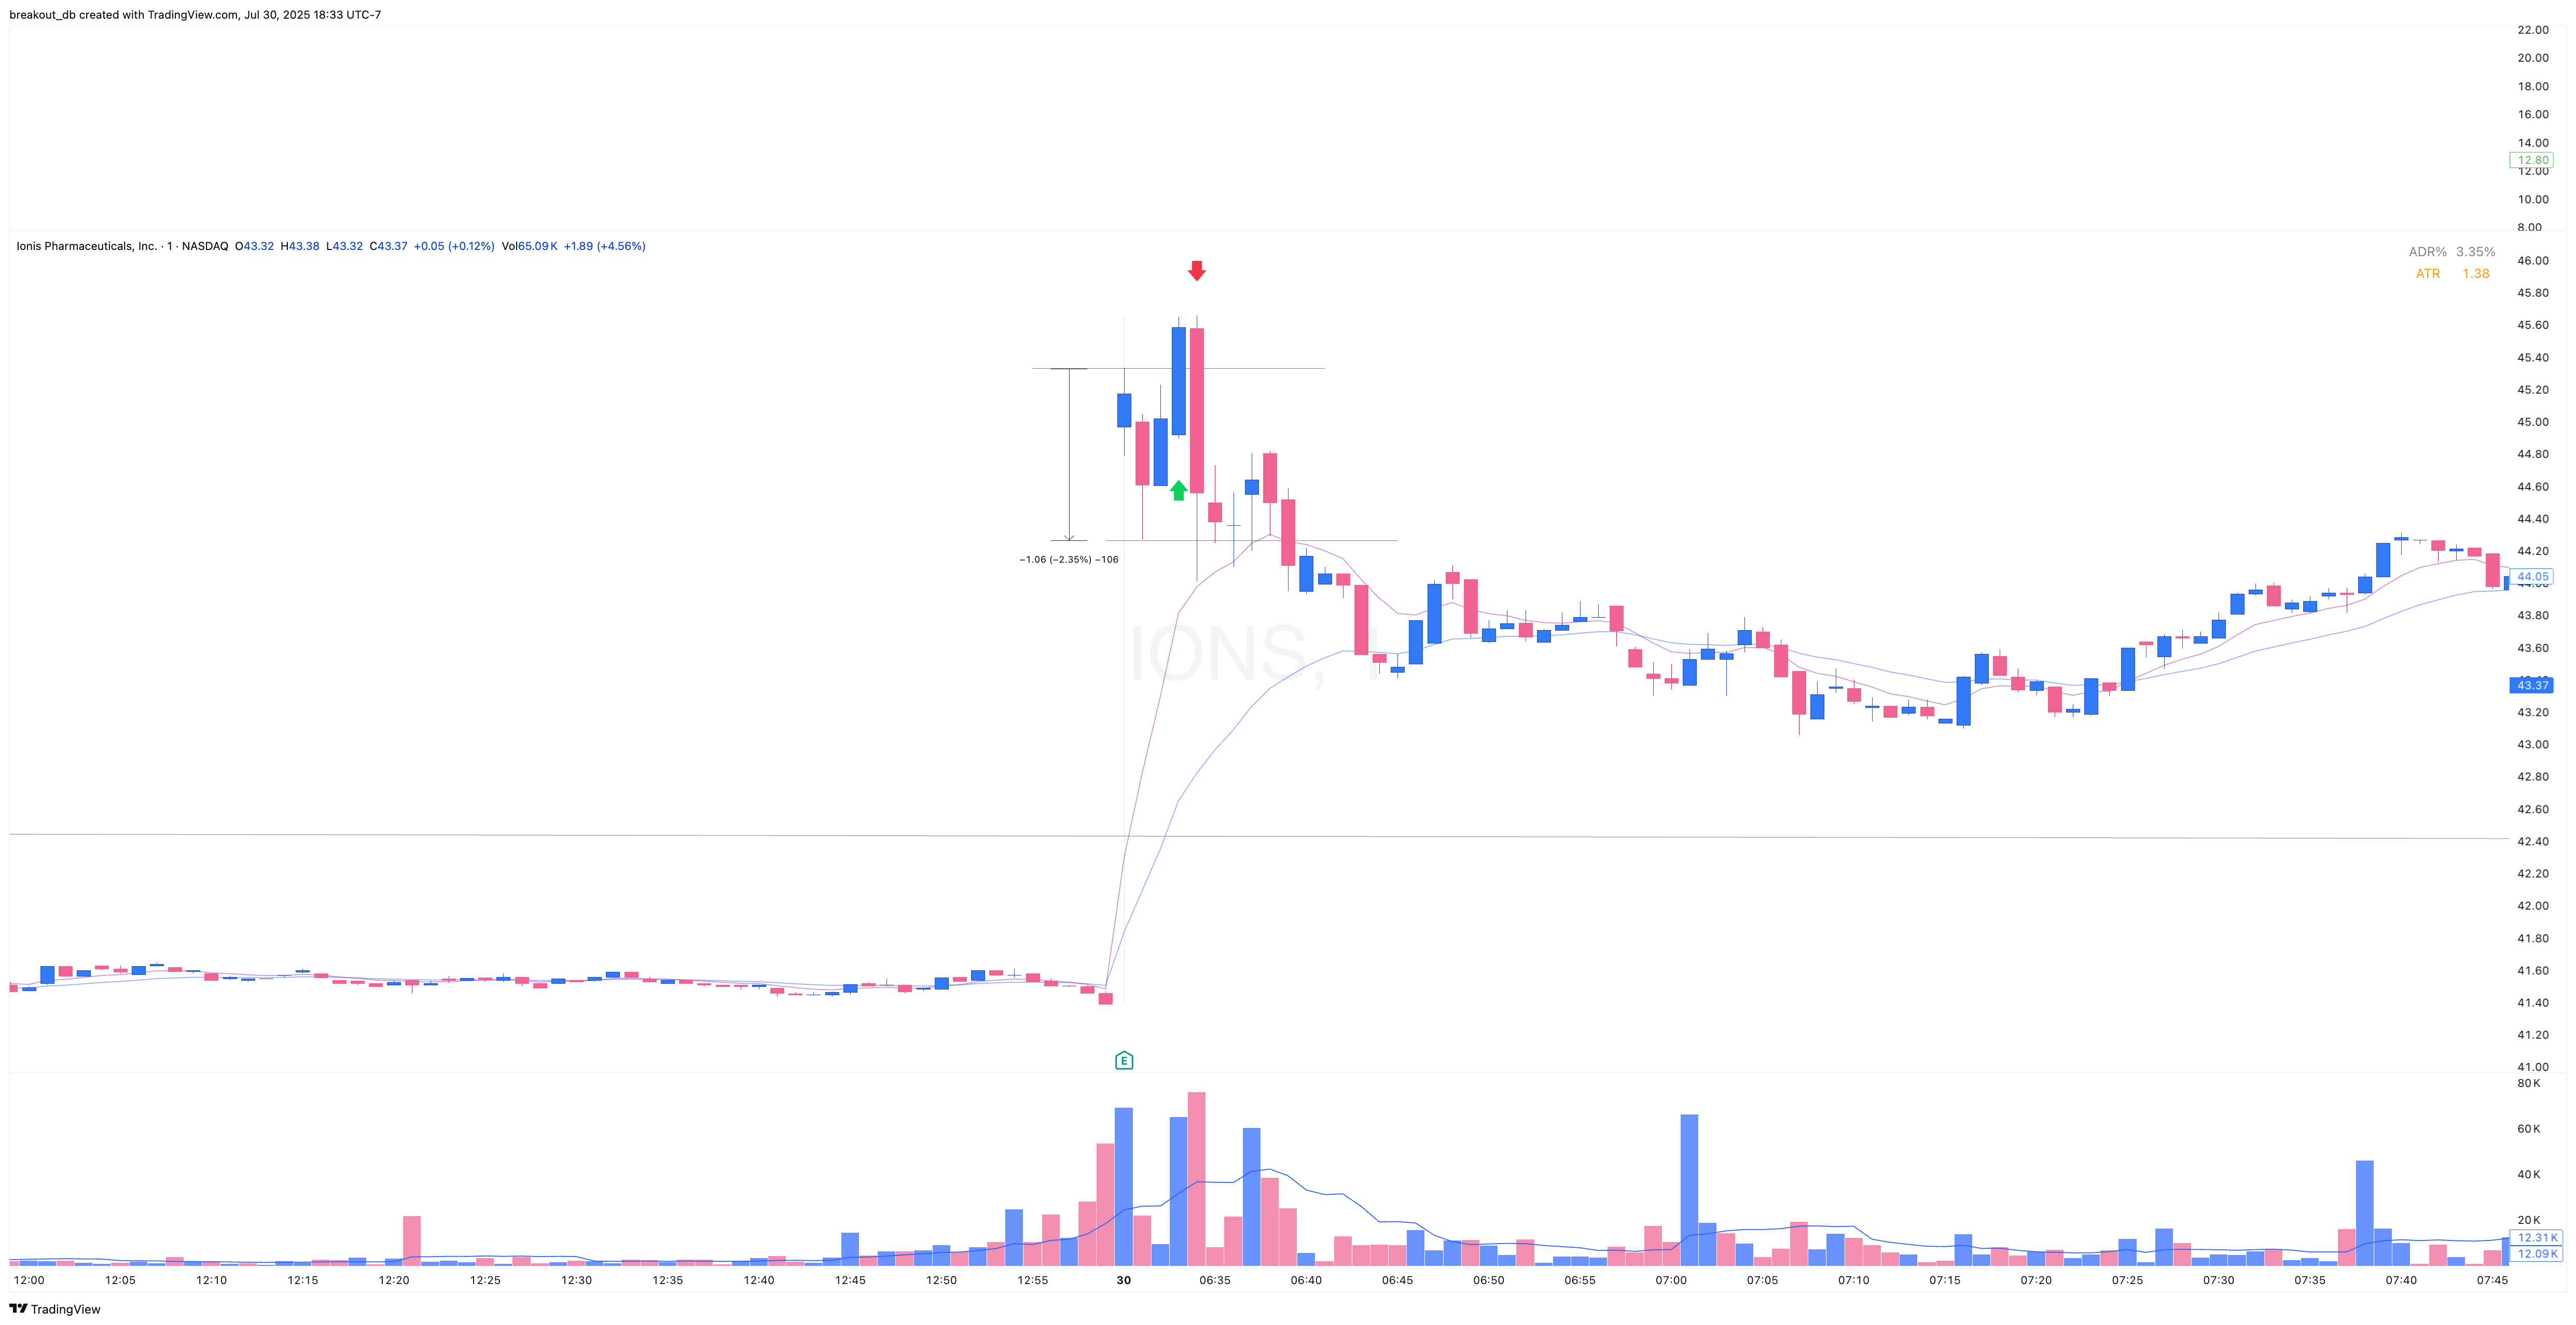
The stock gapped up 7.4% on the news but couldn’t hold momentum—entering via a 1-min ORB and using the day’s low as a stop would’ve resulted in a modest 1.3% loss.
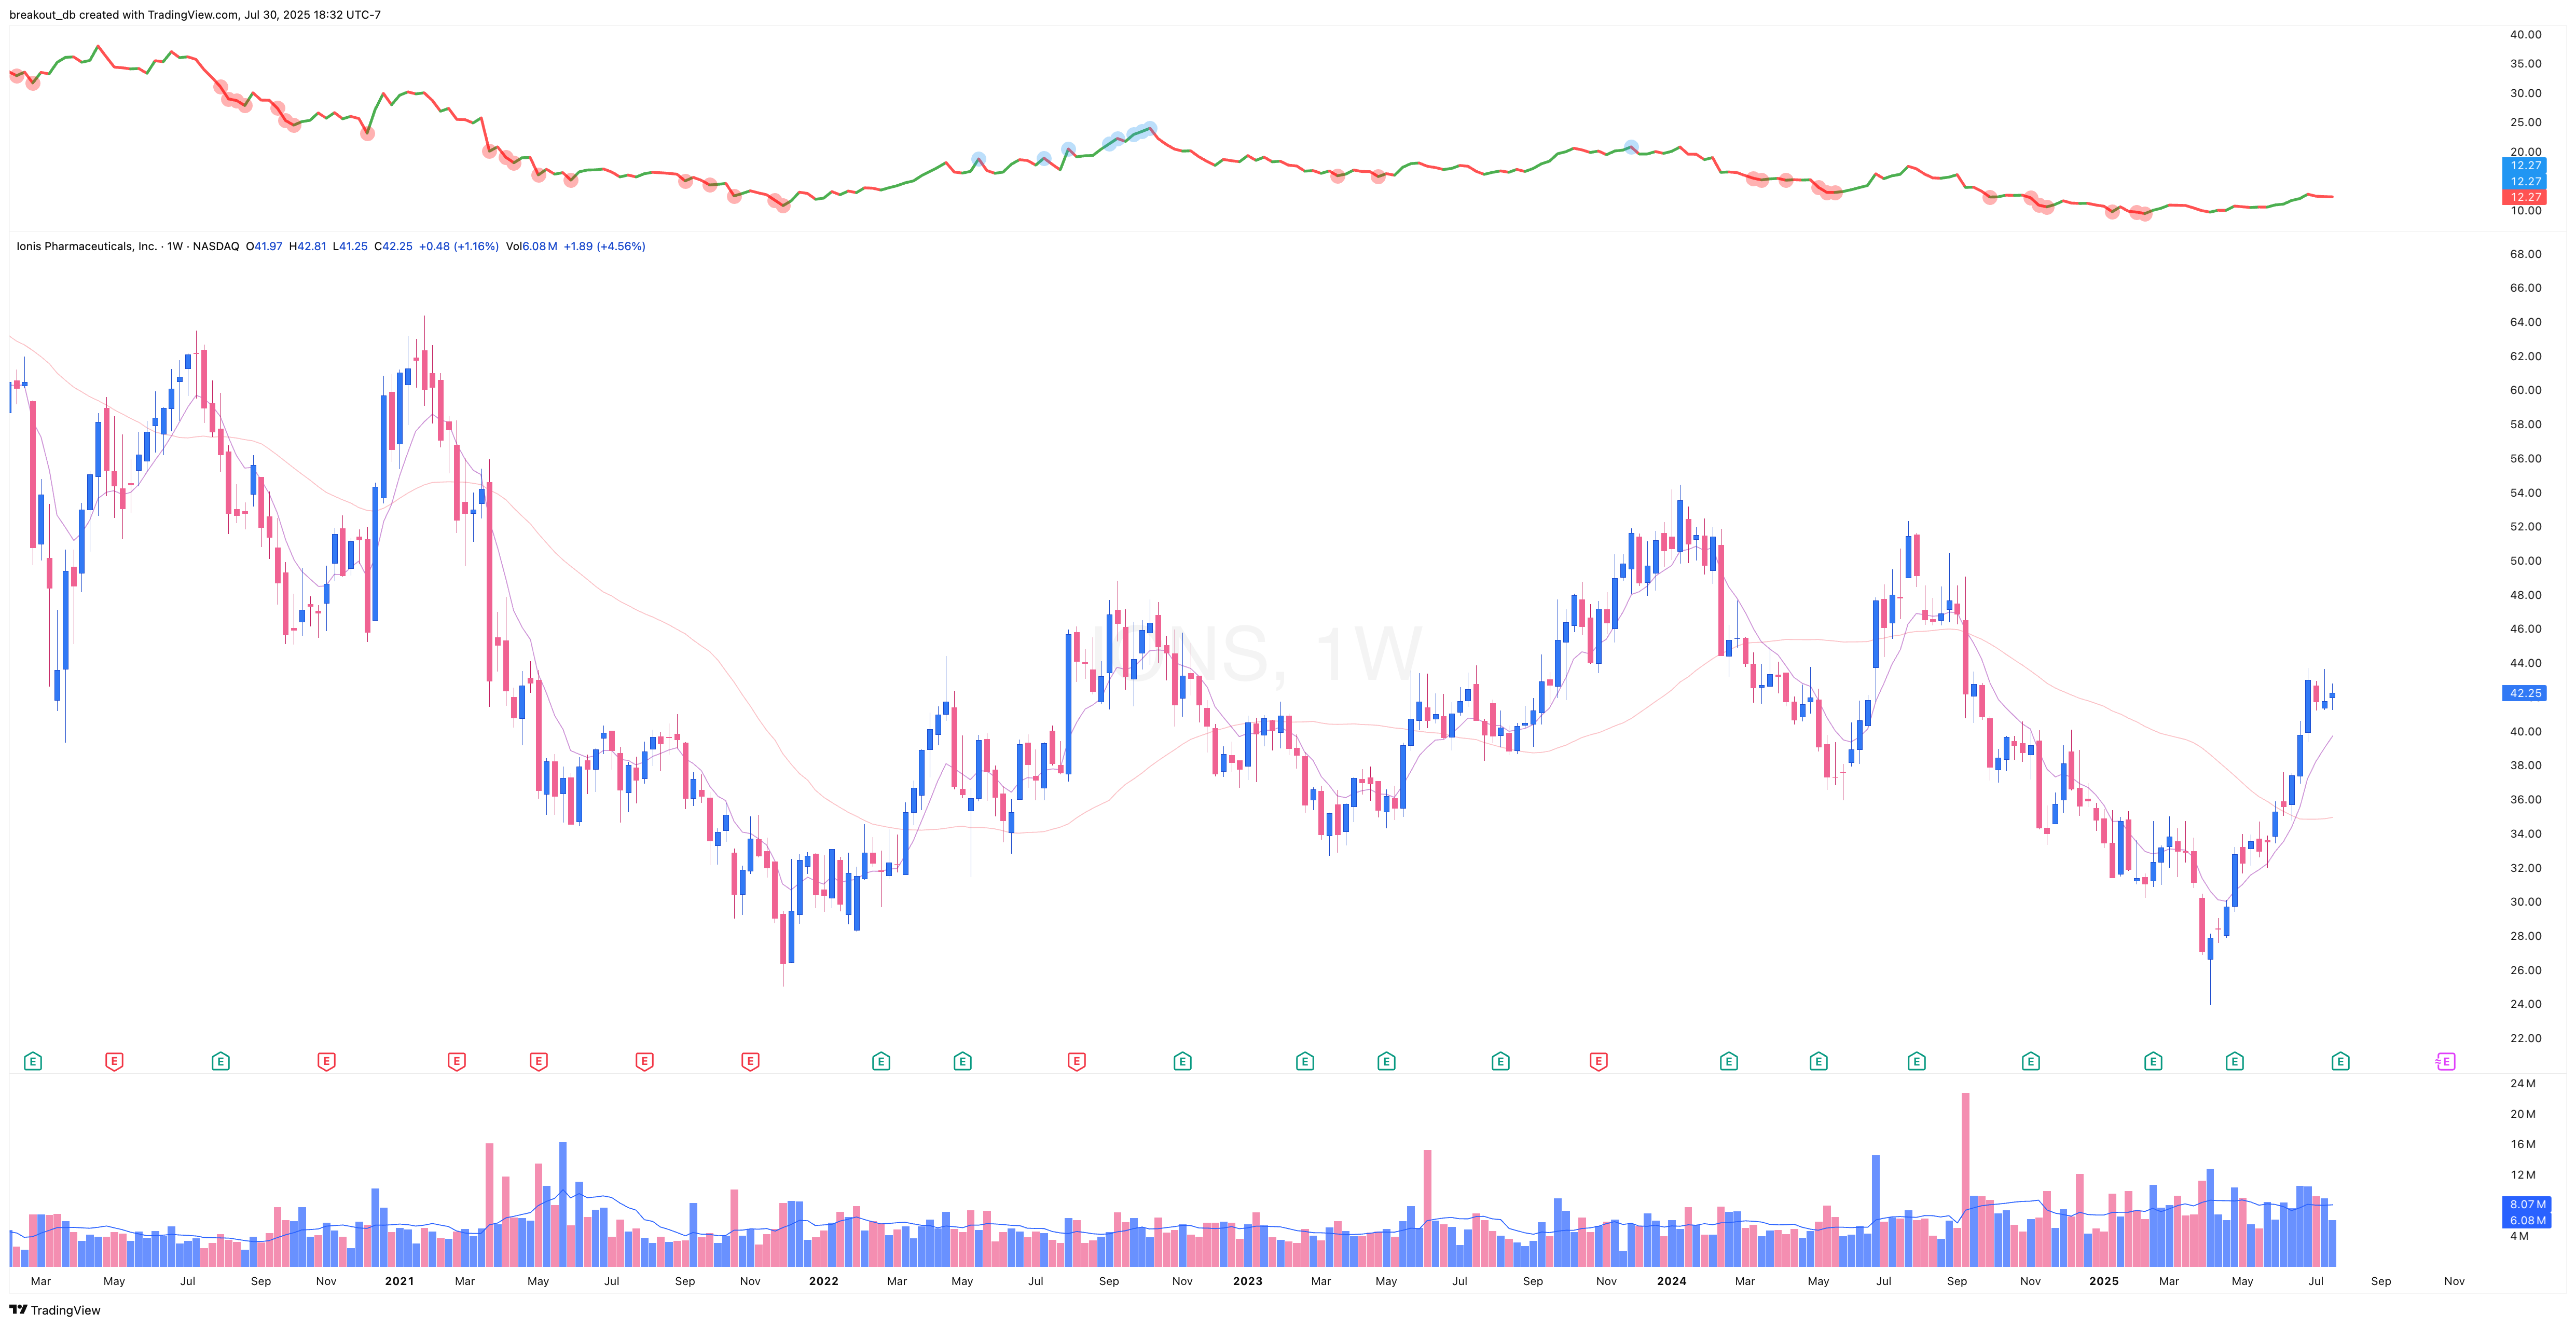
Before Breakout Weekly
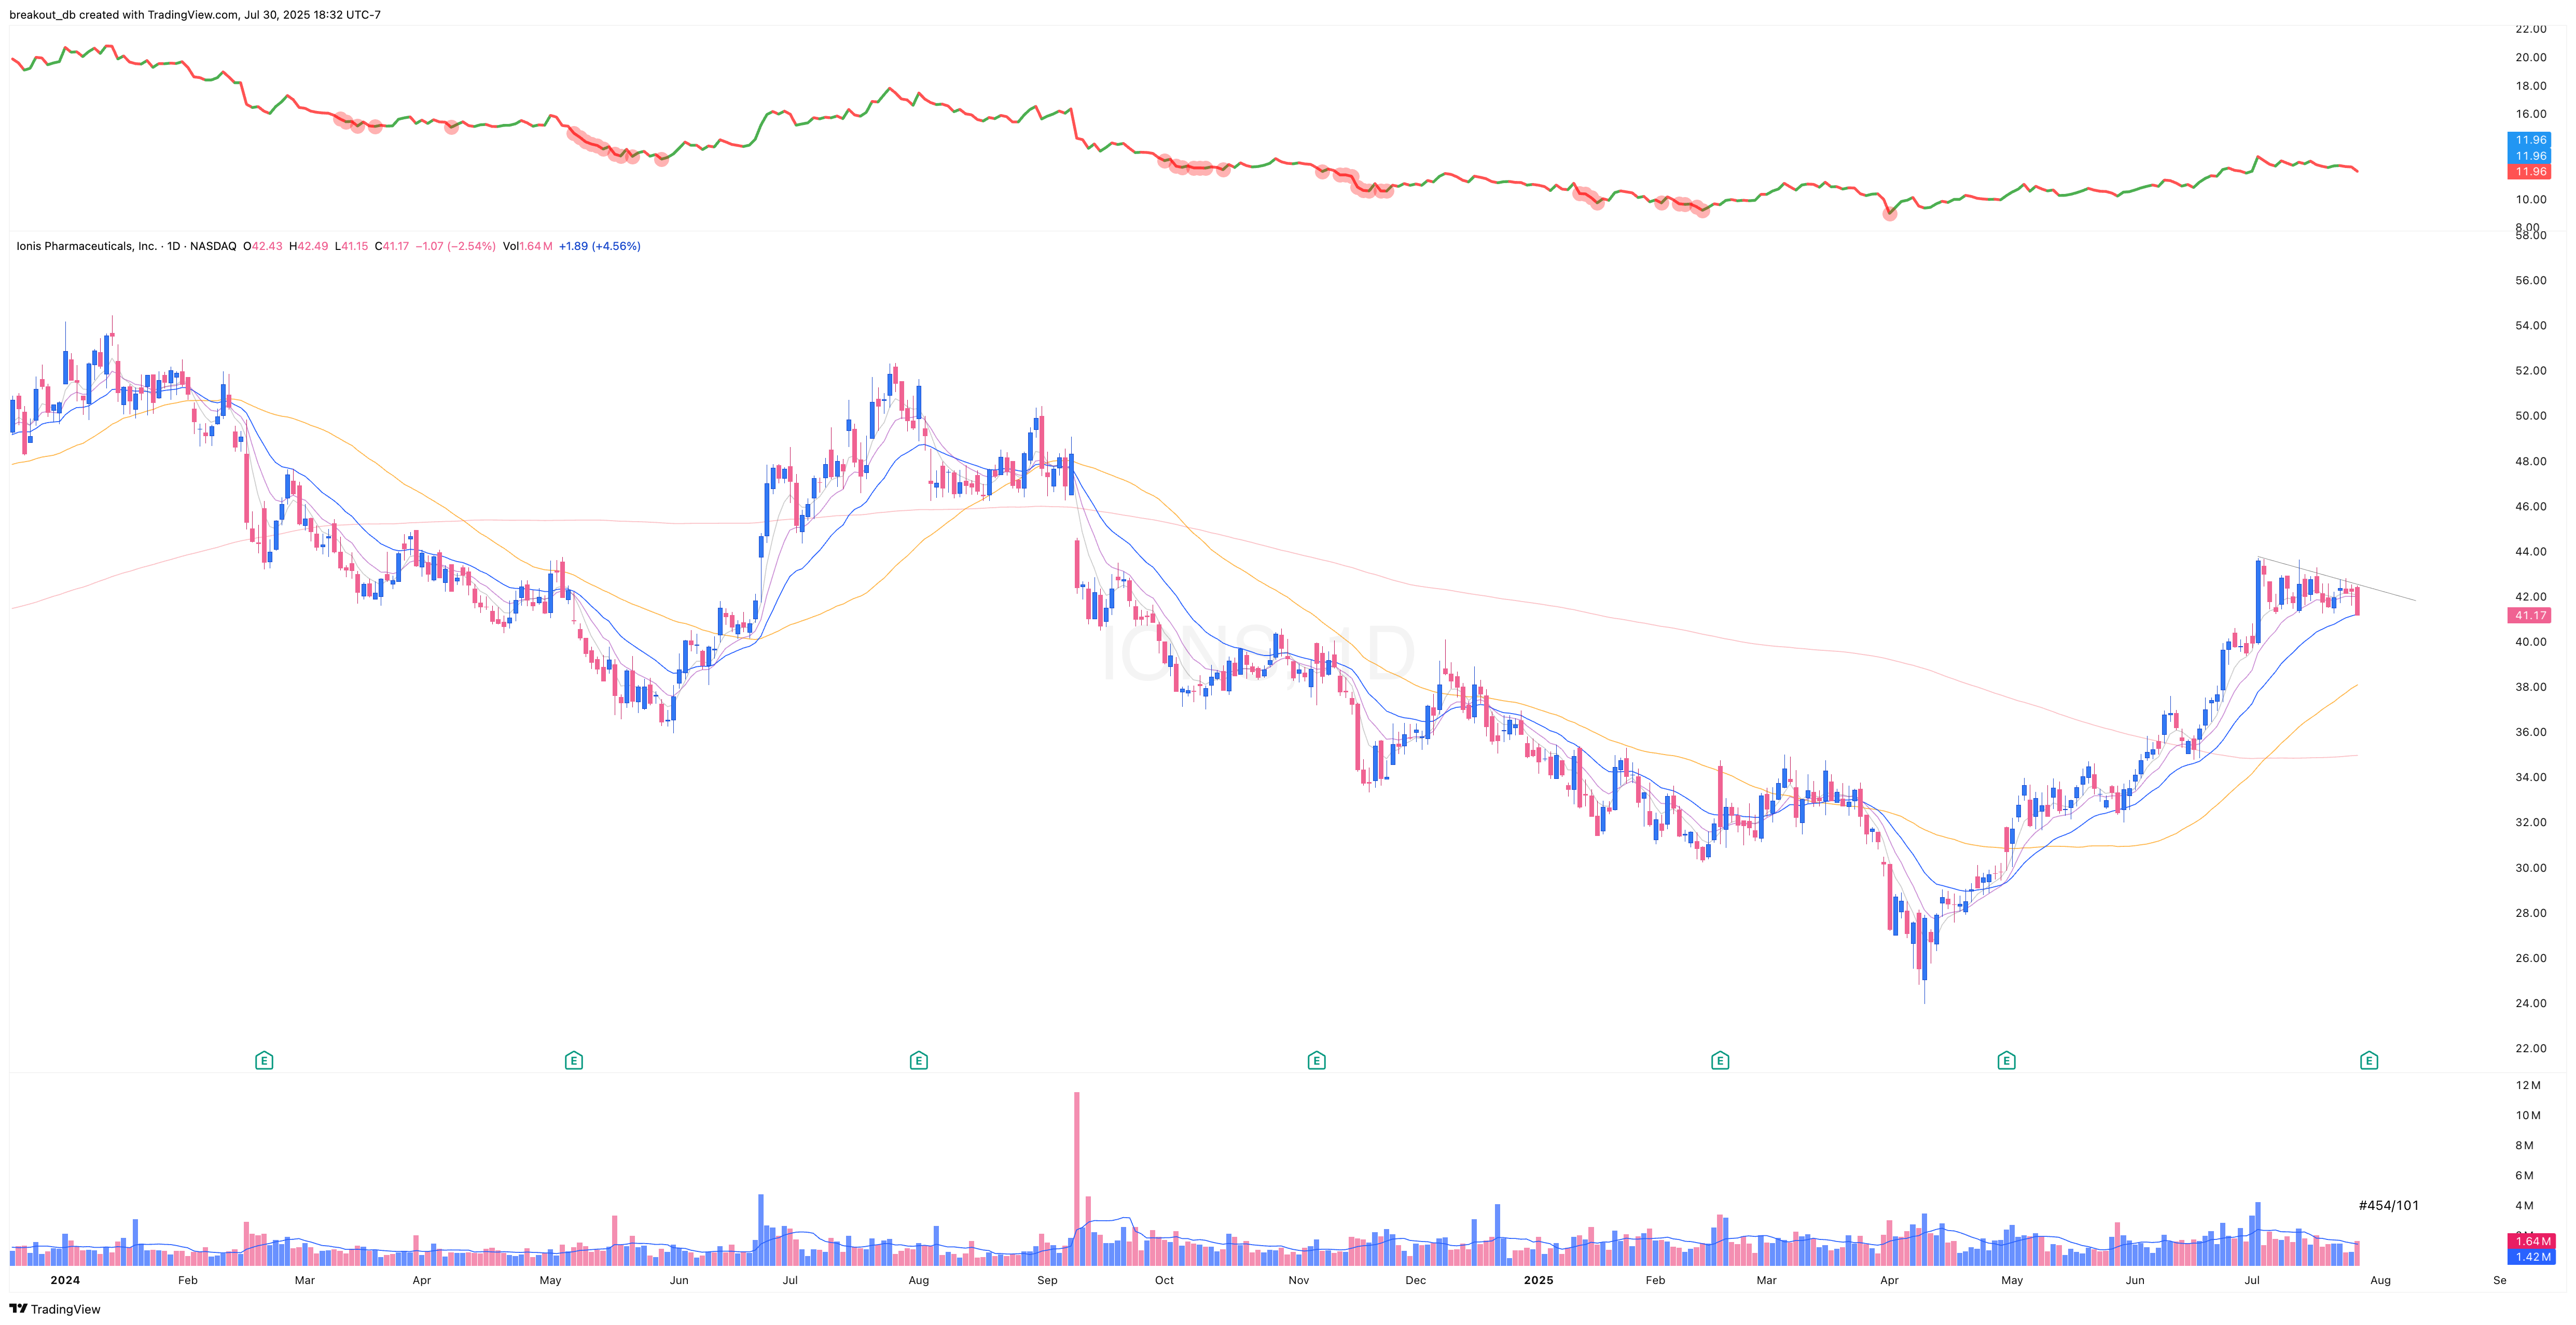
Before Breakout Daily
Intraday Entry
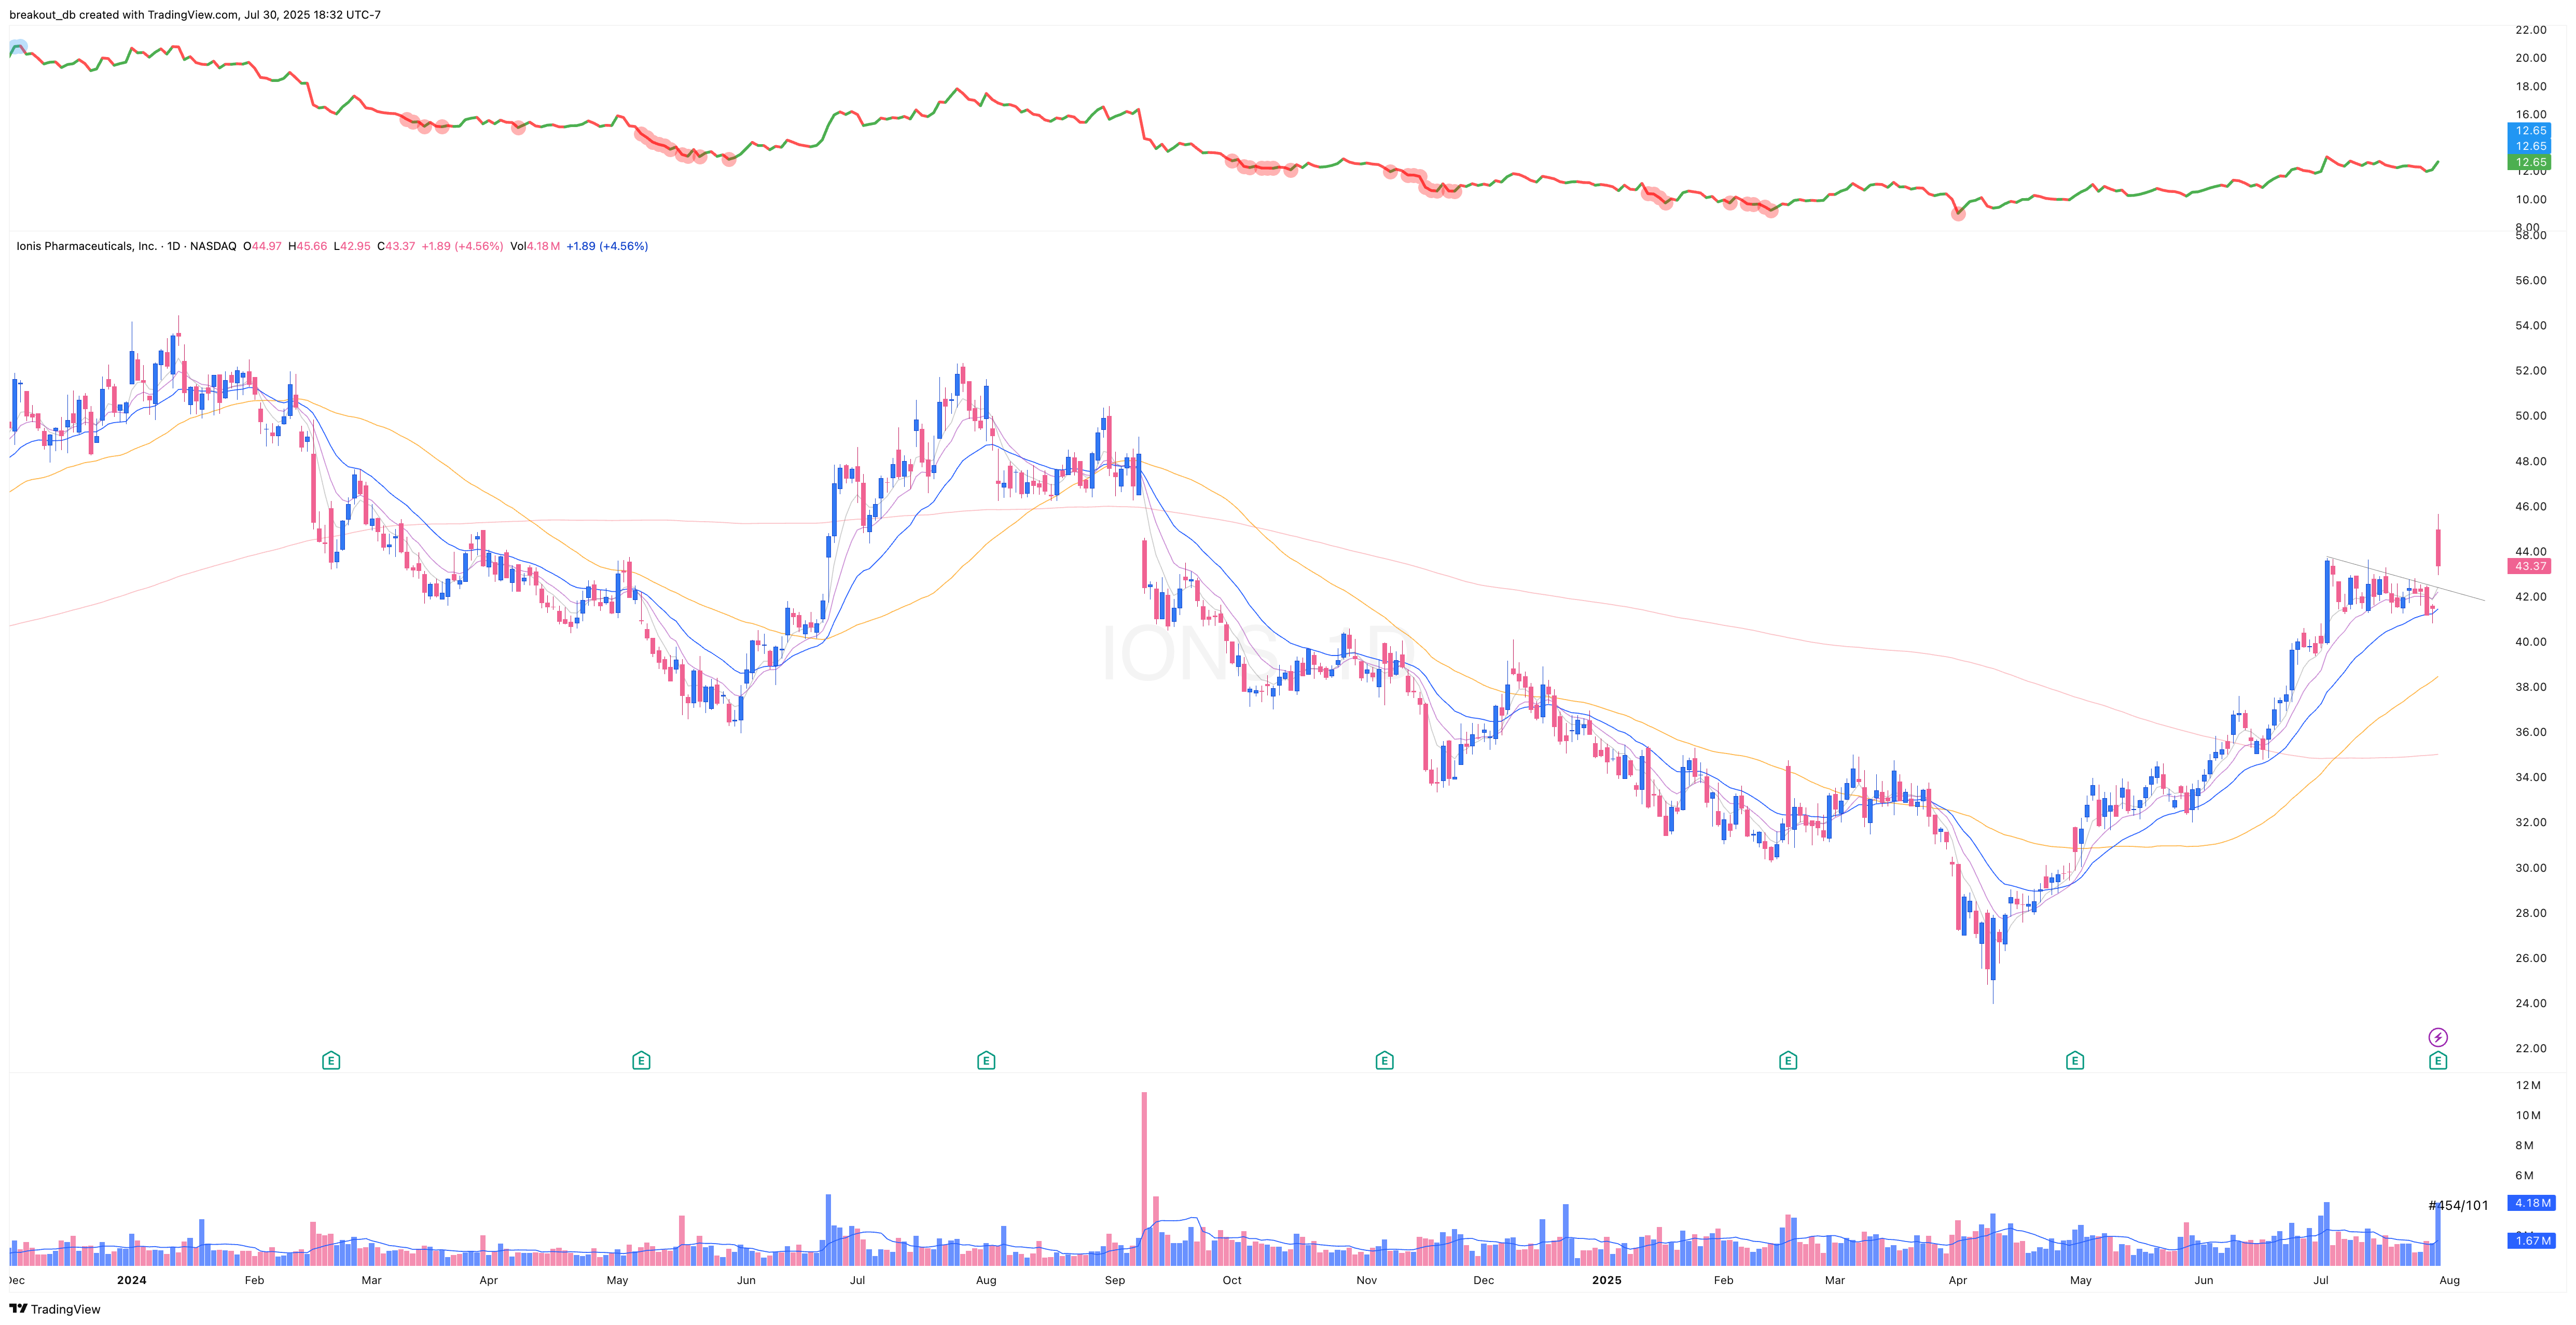
After Breakout
Market Correlation Analysis for IONS
Top Similar Tickers
Stocks that move in the same direction as IONS