LAZR - High Tight Flag - 2021-01-25
LAZR Trade Summary
Performance metrics and trade details for LAZR breakout.
- About
LAZR Breakout Trade Analysis:
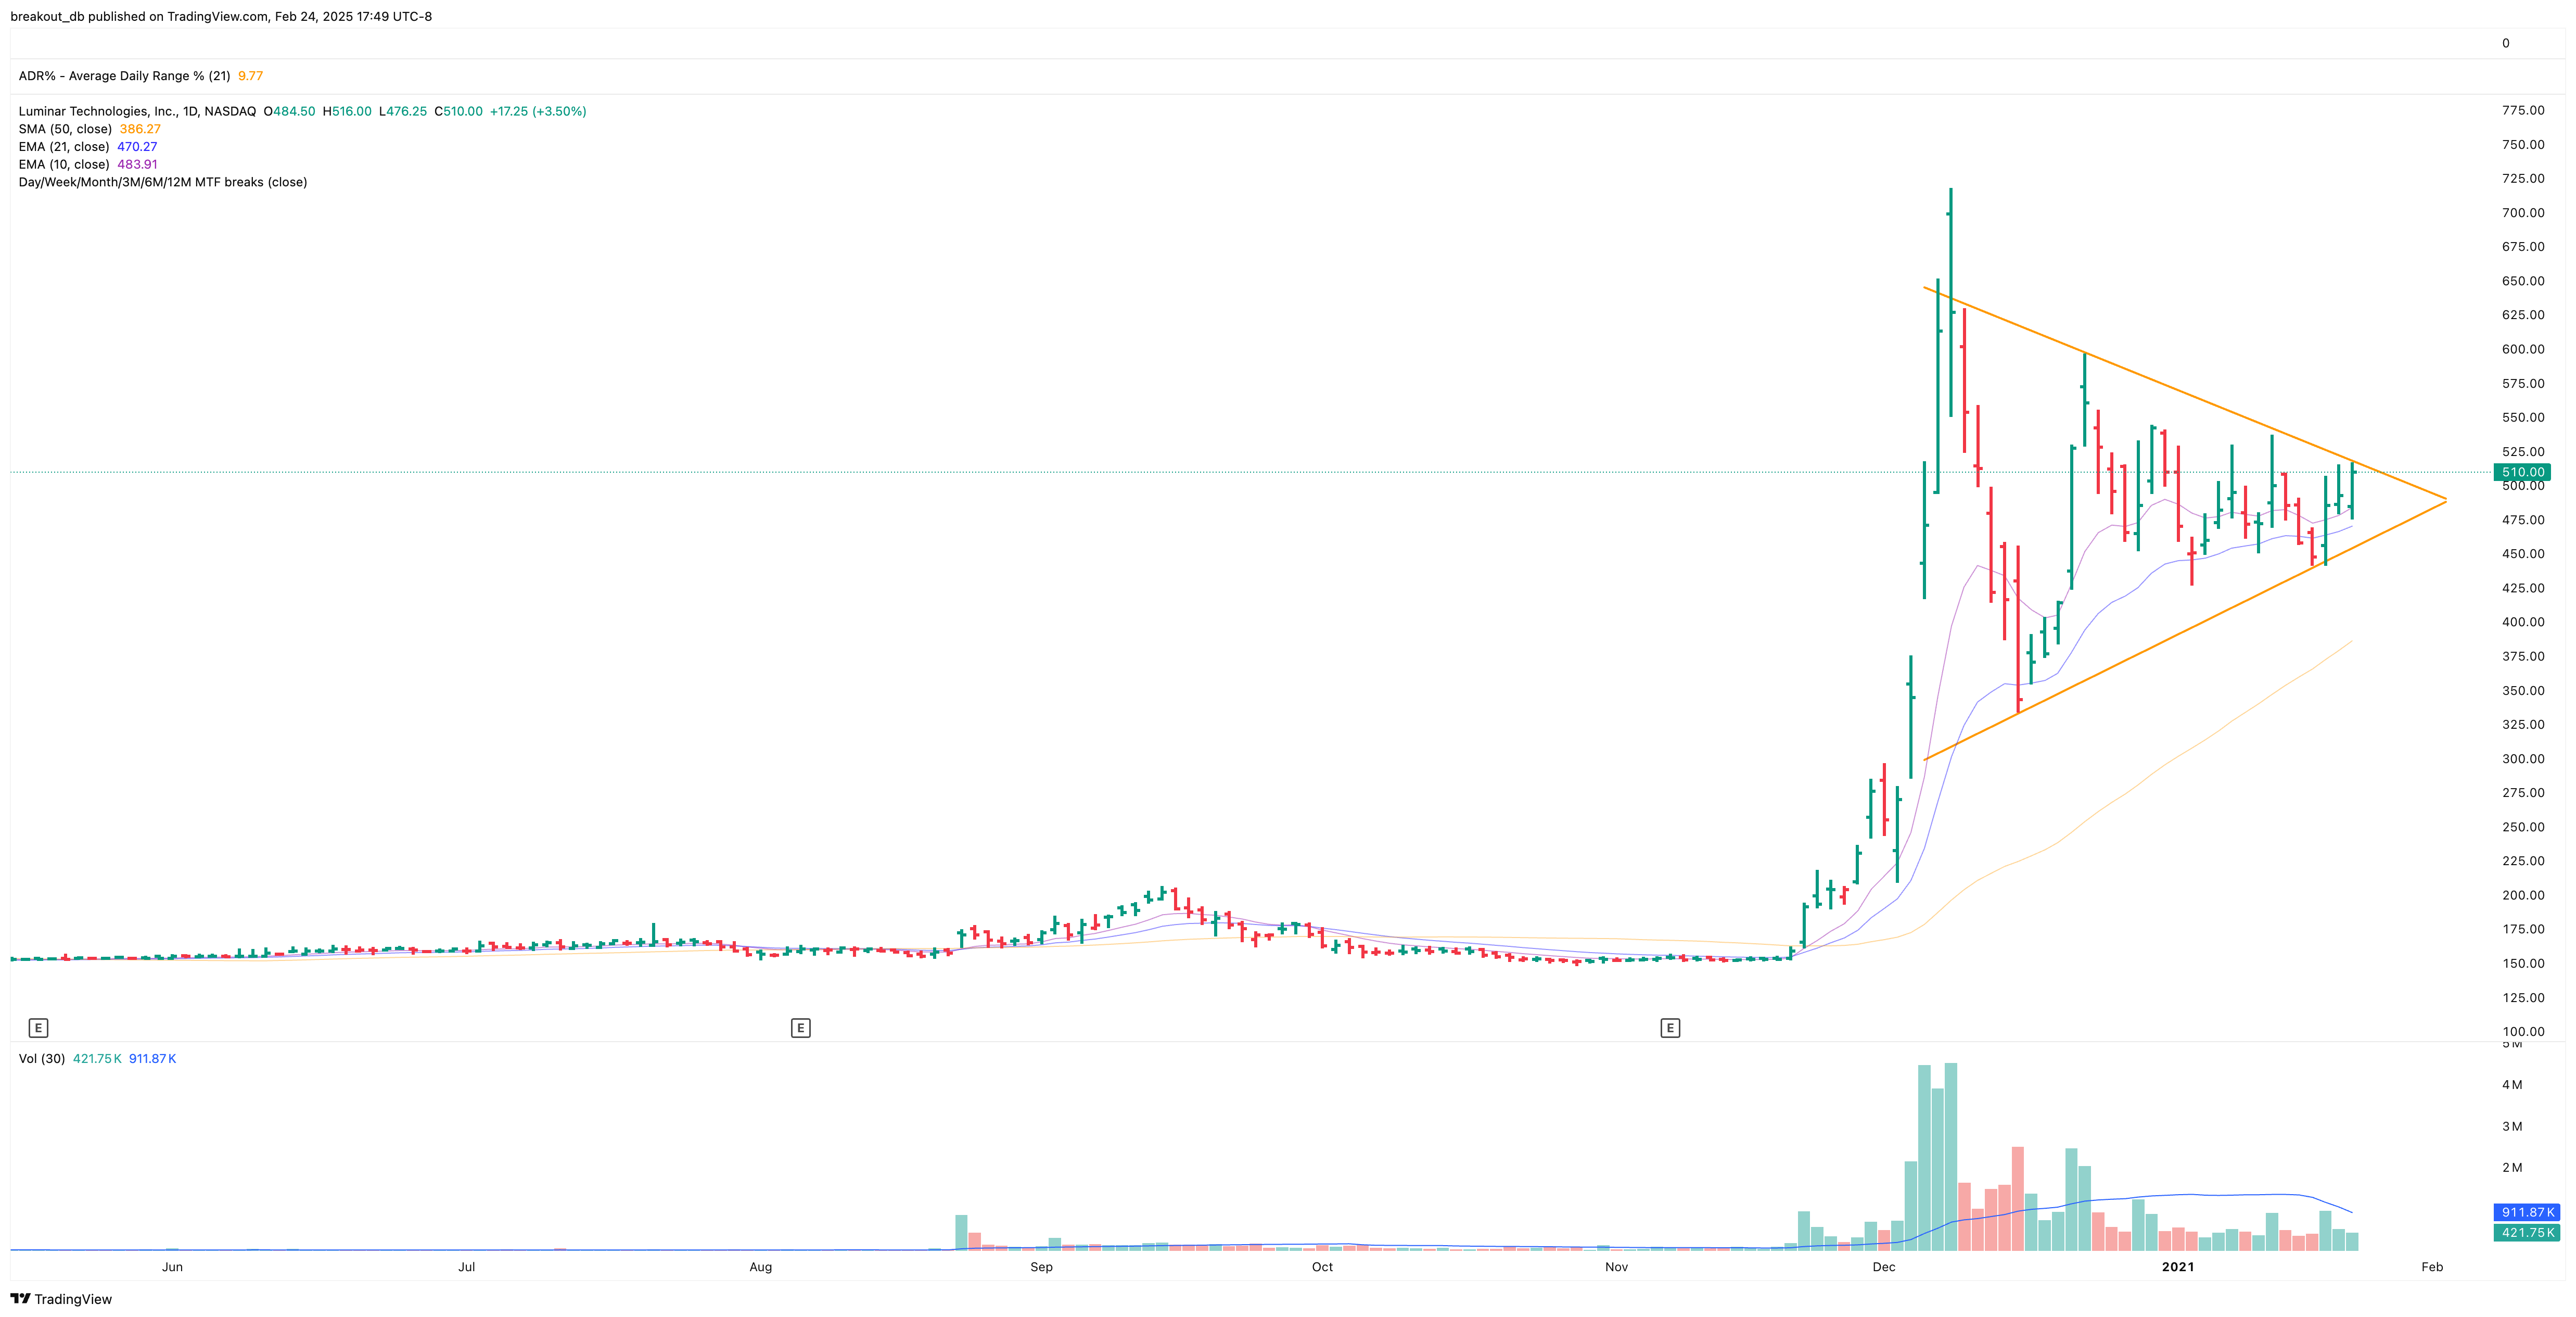
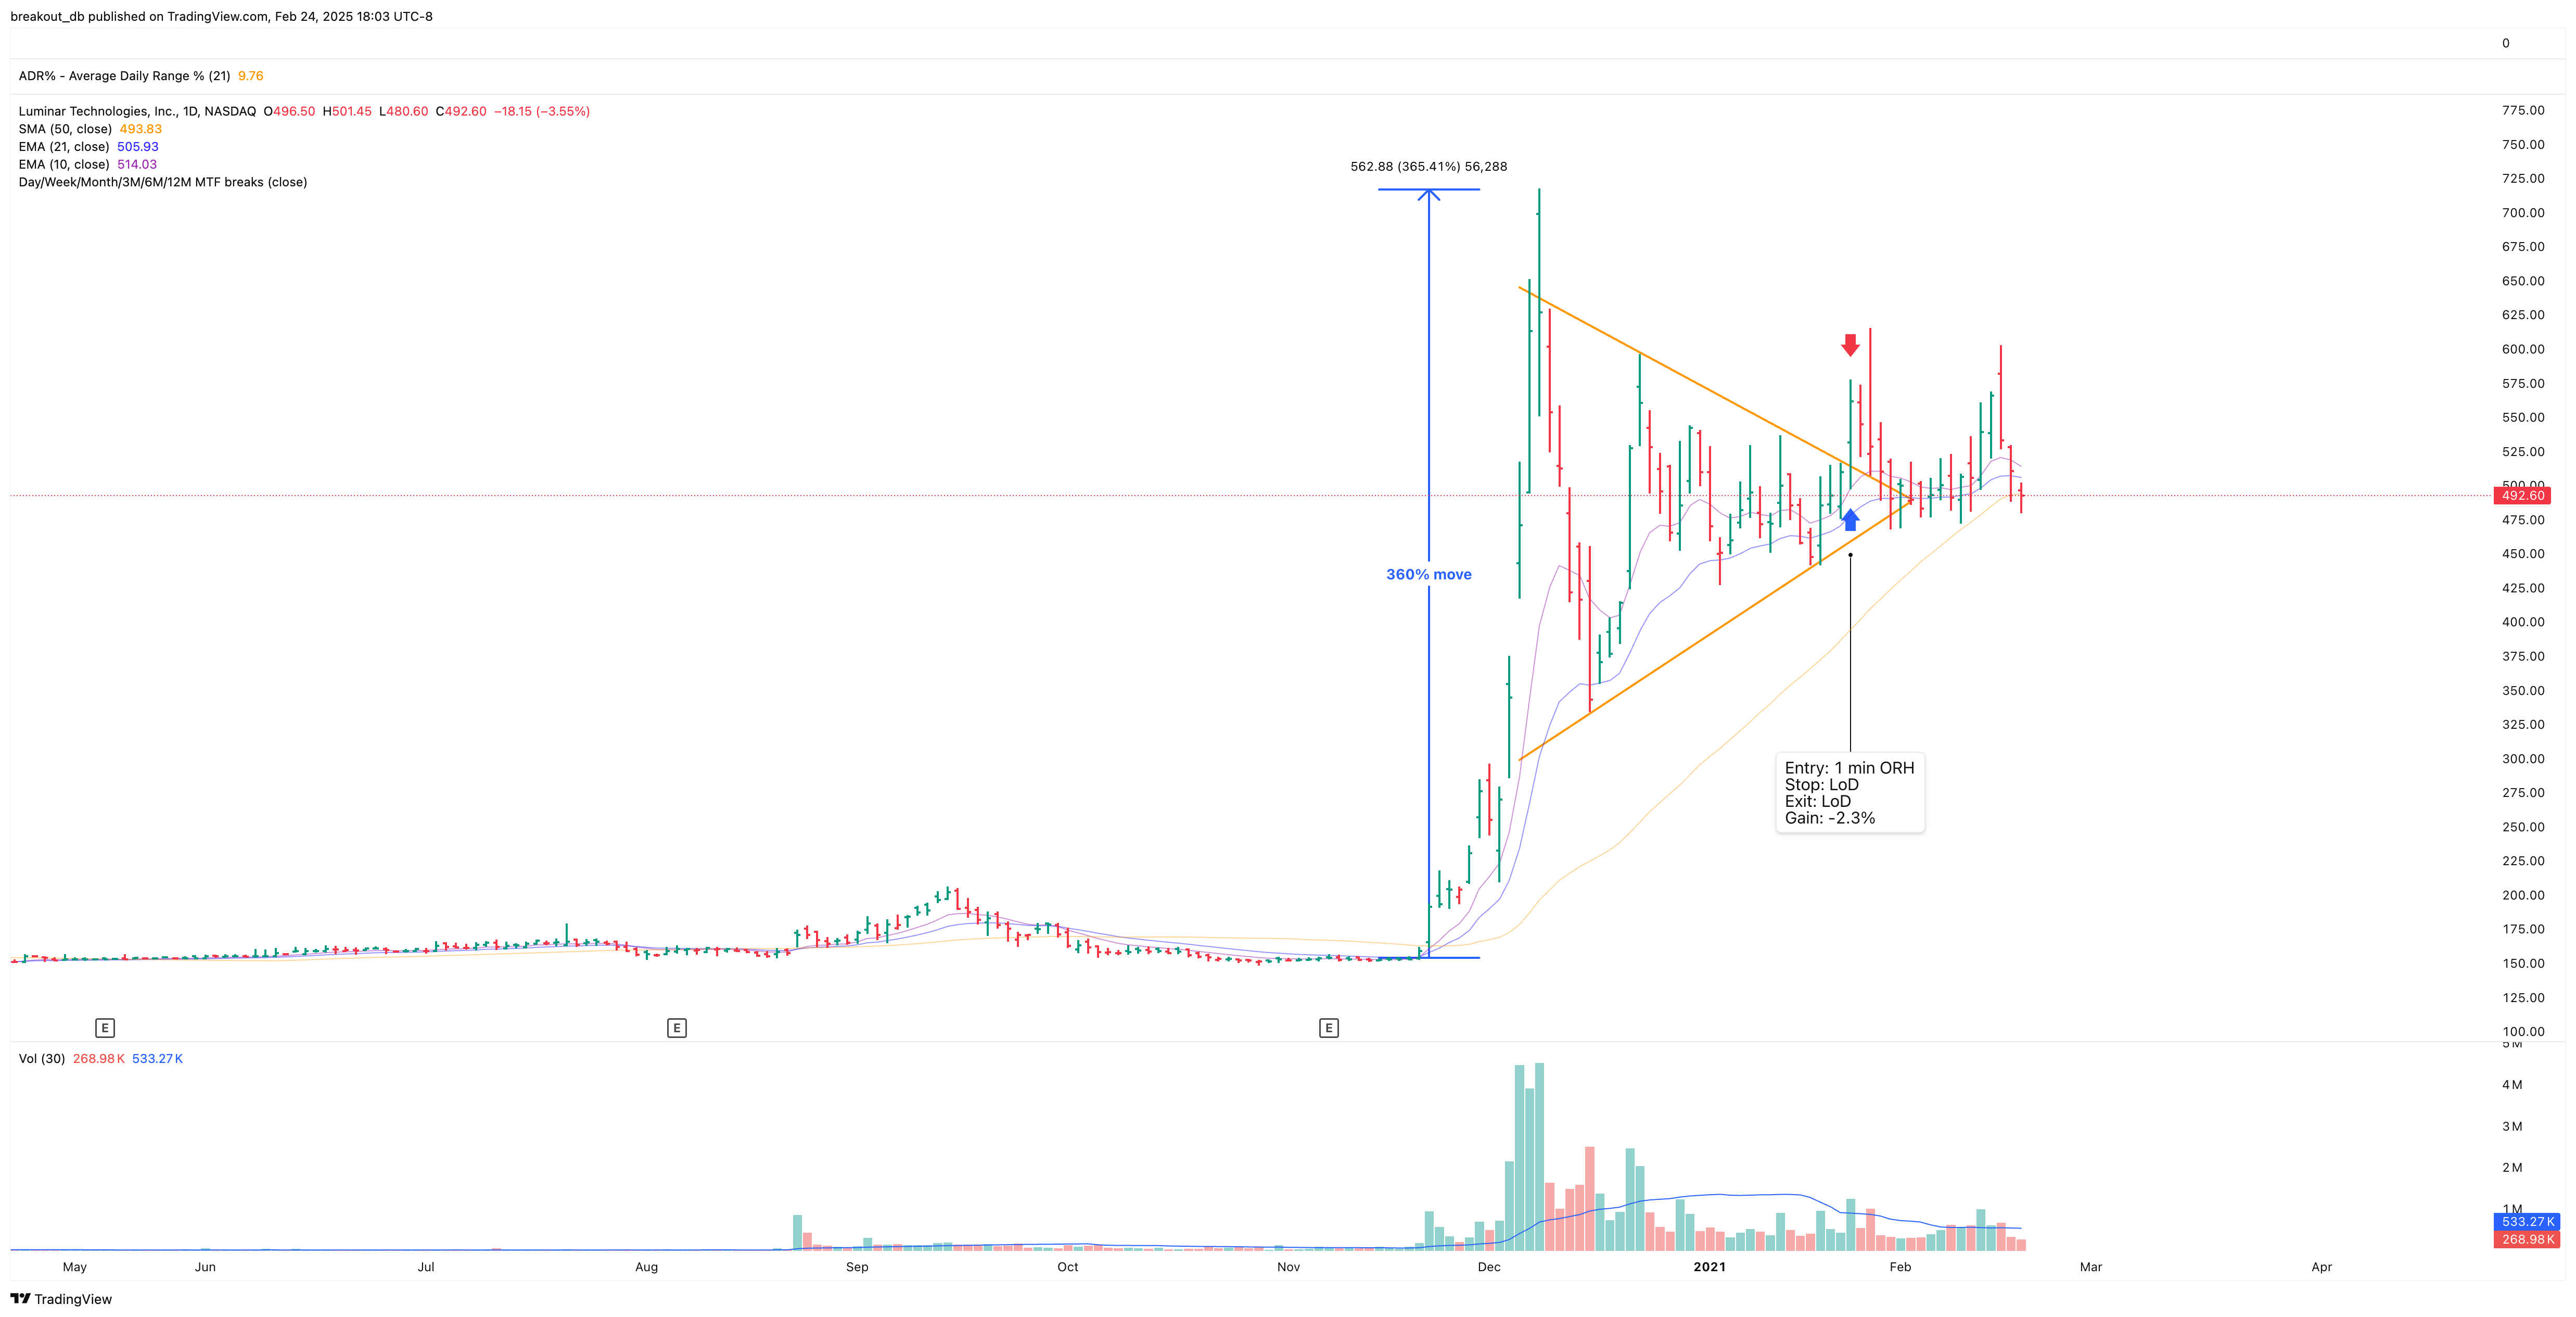
- Initial Move: Stock surged 360% before entering consolidation.
- Pattern Formation: Developed a tightening triangle in a classic "Qullamaggie" style, hovering between the 10 and 21 EMAs.
- Breakout Attempt: The stock broke out of the triangle and gapped up.
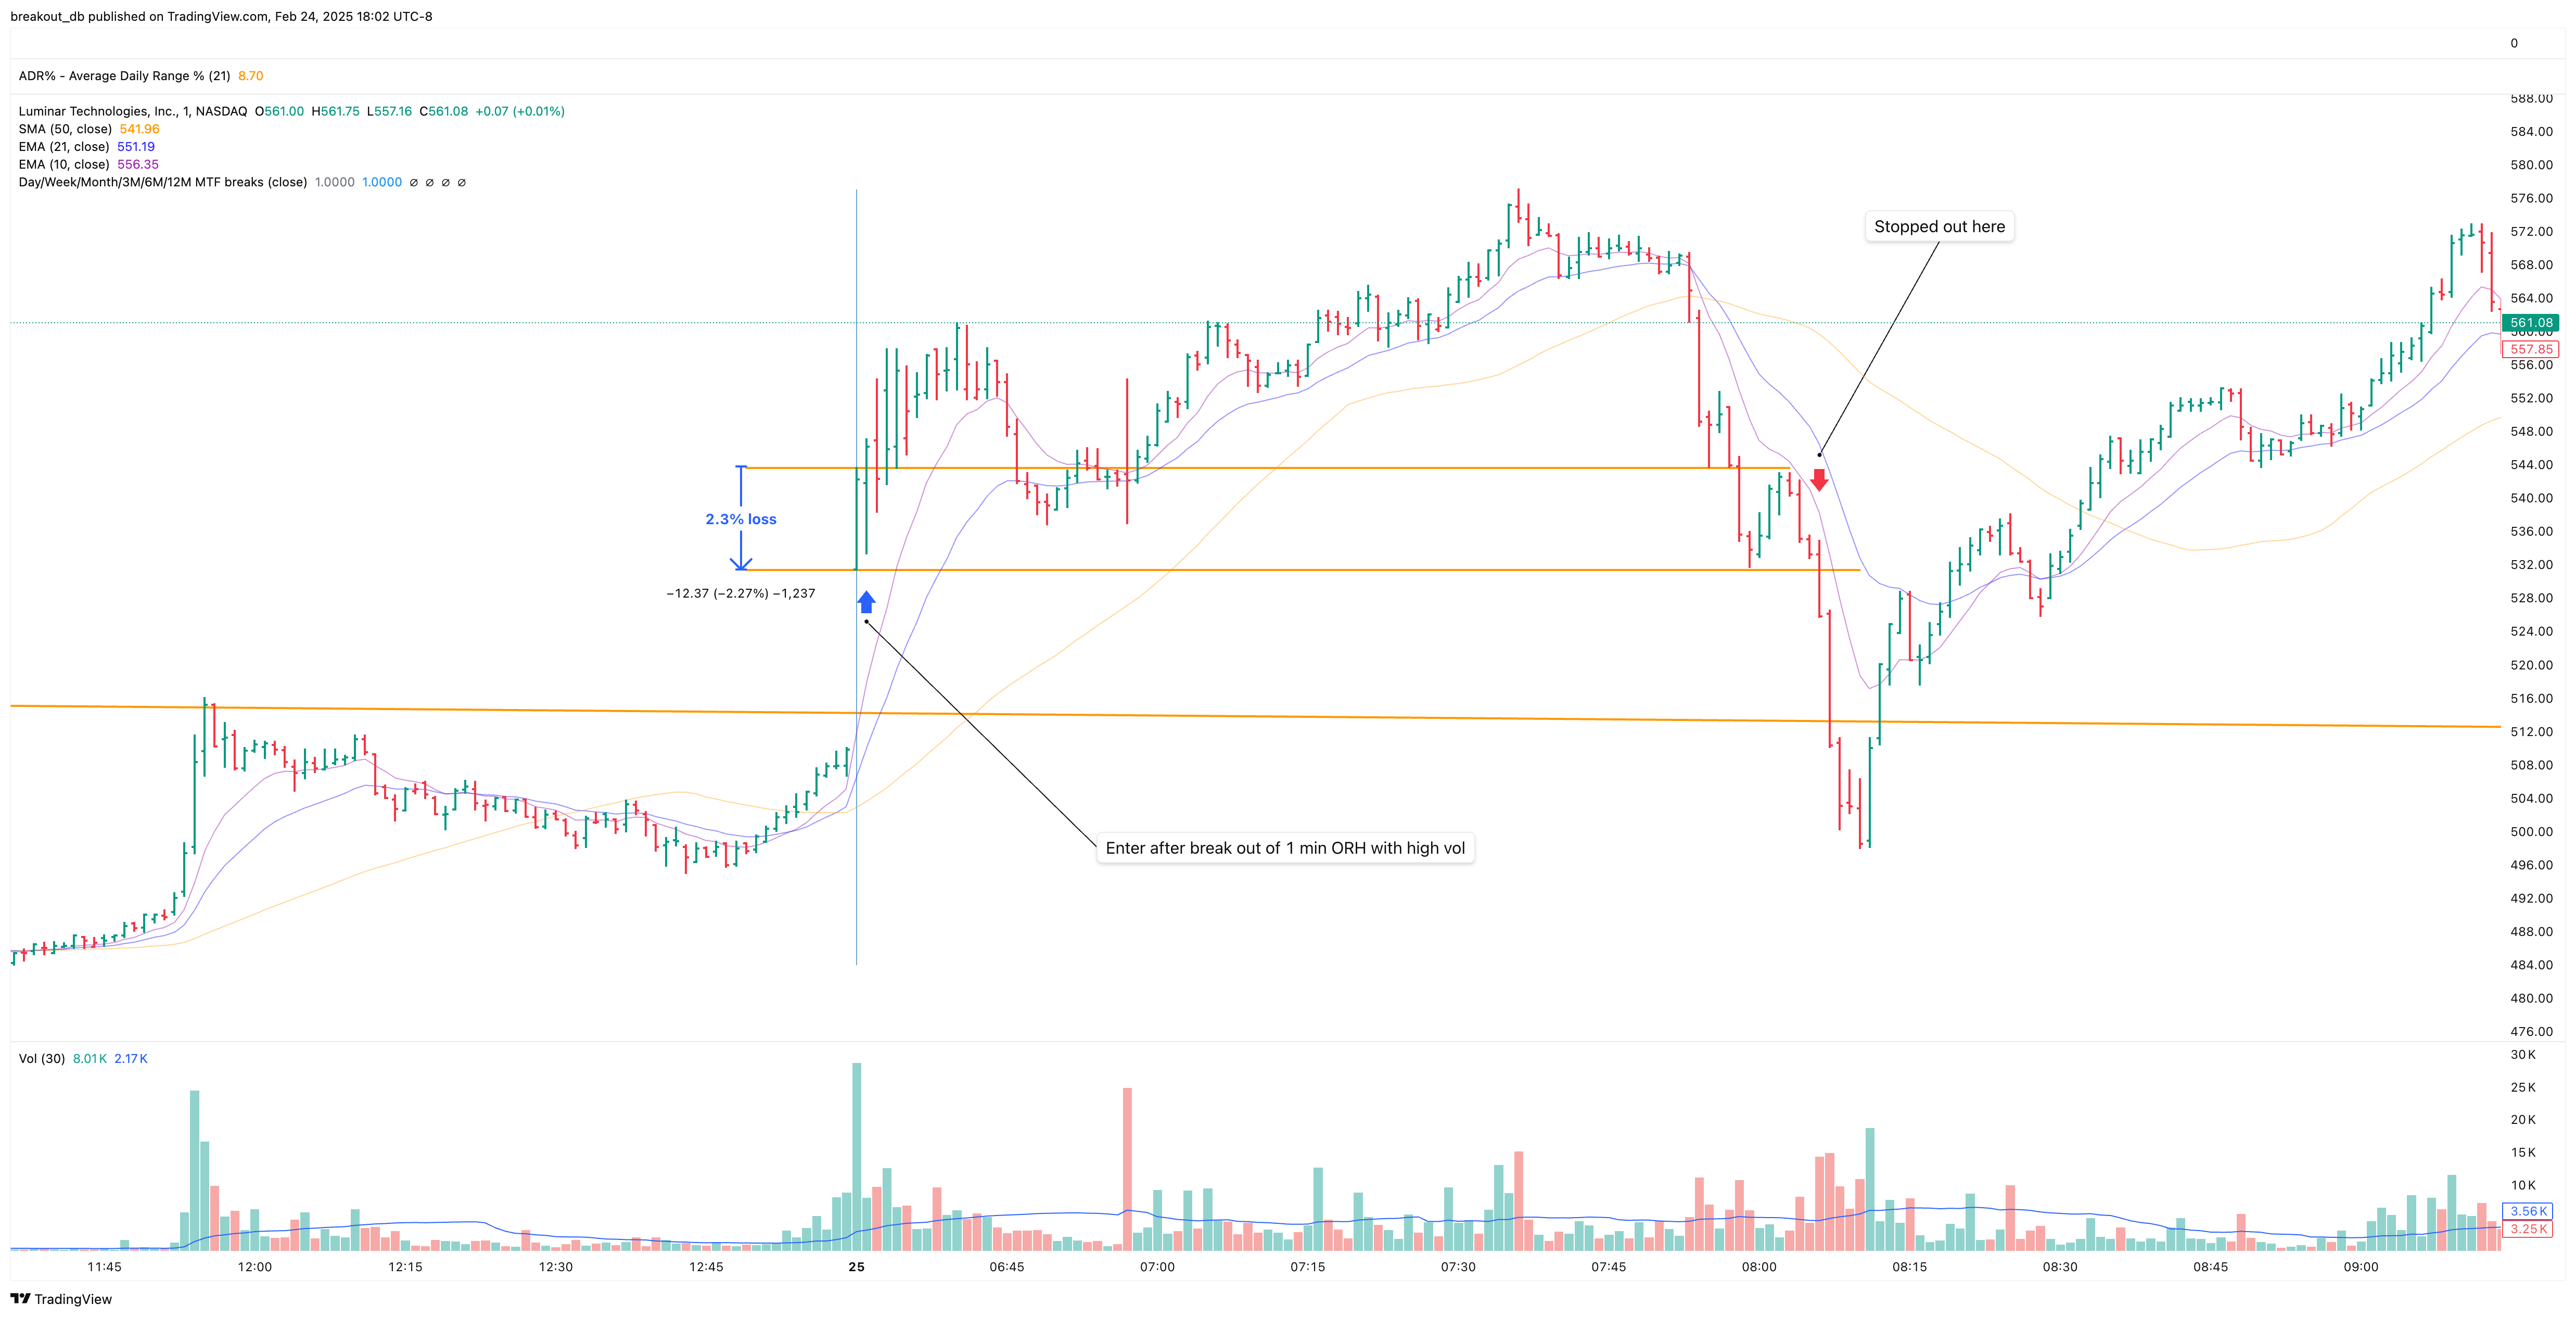
- Entry & Exit: Entering with ORH resulted in a stop-out on the same day with a 2.3% loss.
- Aftermath: The stock continued moving lower in the following days.
The market turned choppy after mid-January 2021, making breakout trades riskier and reinforcing the importance of adapting to market conditions.
Before Breakout Daily

Intraday Entry

After Breakout

Top Similar Stocks for LAZR
| Rank | Ticker | Score |
|---|---|---|
| 1 | NNOX |
45%
|