NOW - High Tight Flag - 2025-05-28
NOW Trade Summary
Performance metrics and trade details for NOW breakout.
- Risk
- 1.0%
- Market Condition
- Choppy
- Entry
- Breakout
- Stop
- LoD
- About
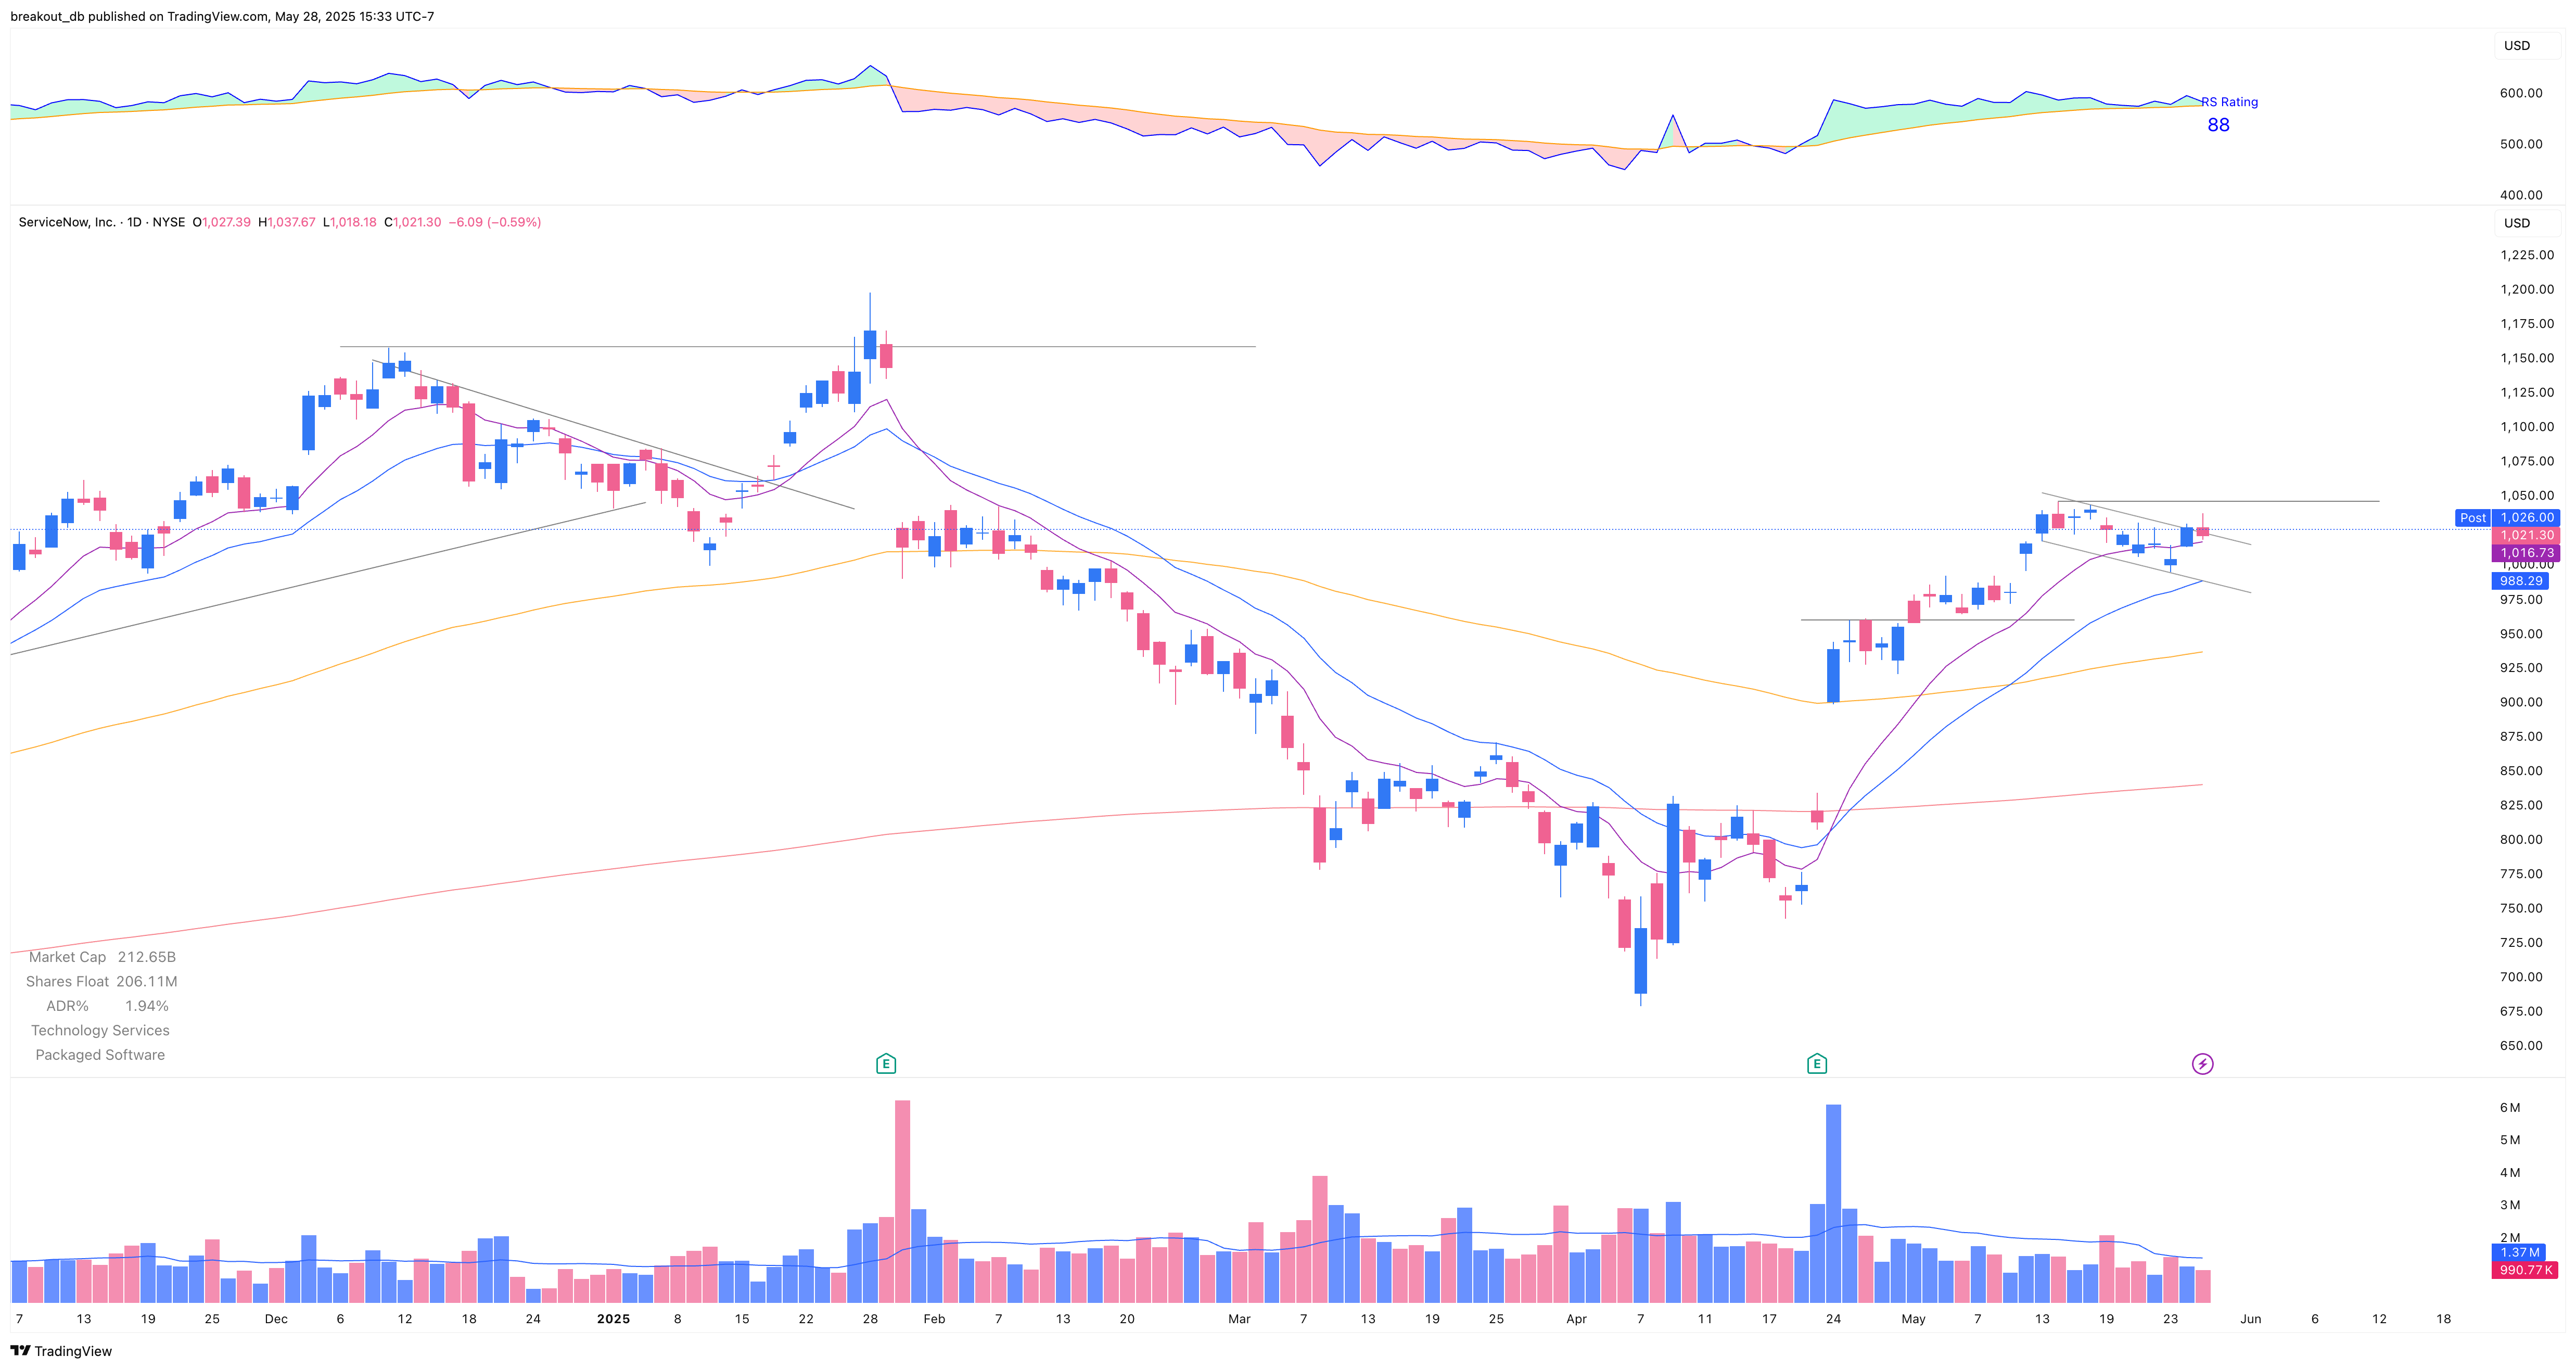
ServiceNow's stock surged following a strong earnings report on April 23rd. It approached previous overhead supply in the $1000–$1050 range and formed a bull flag pattern.
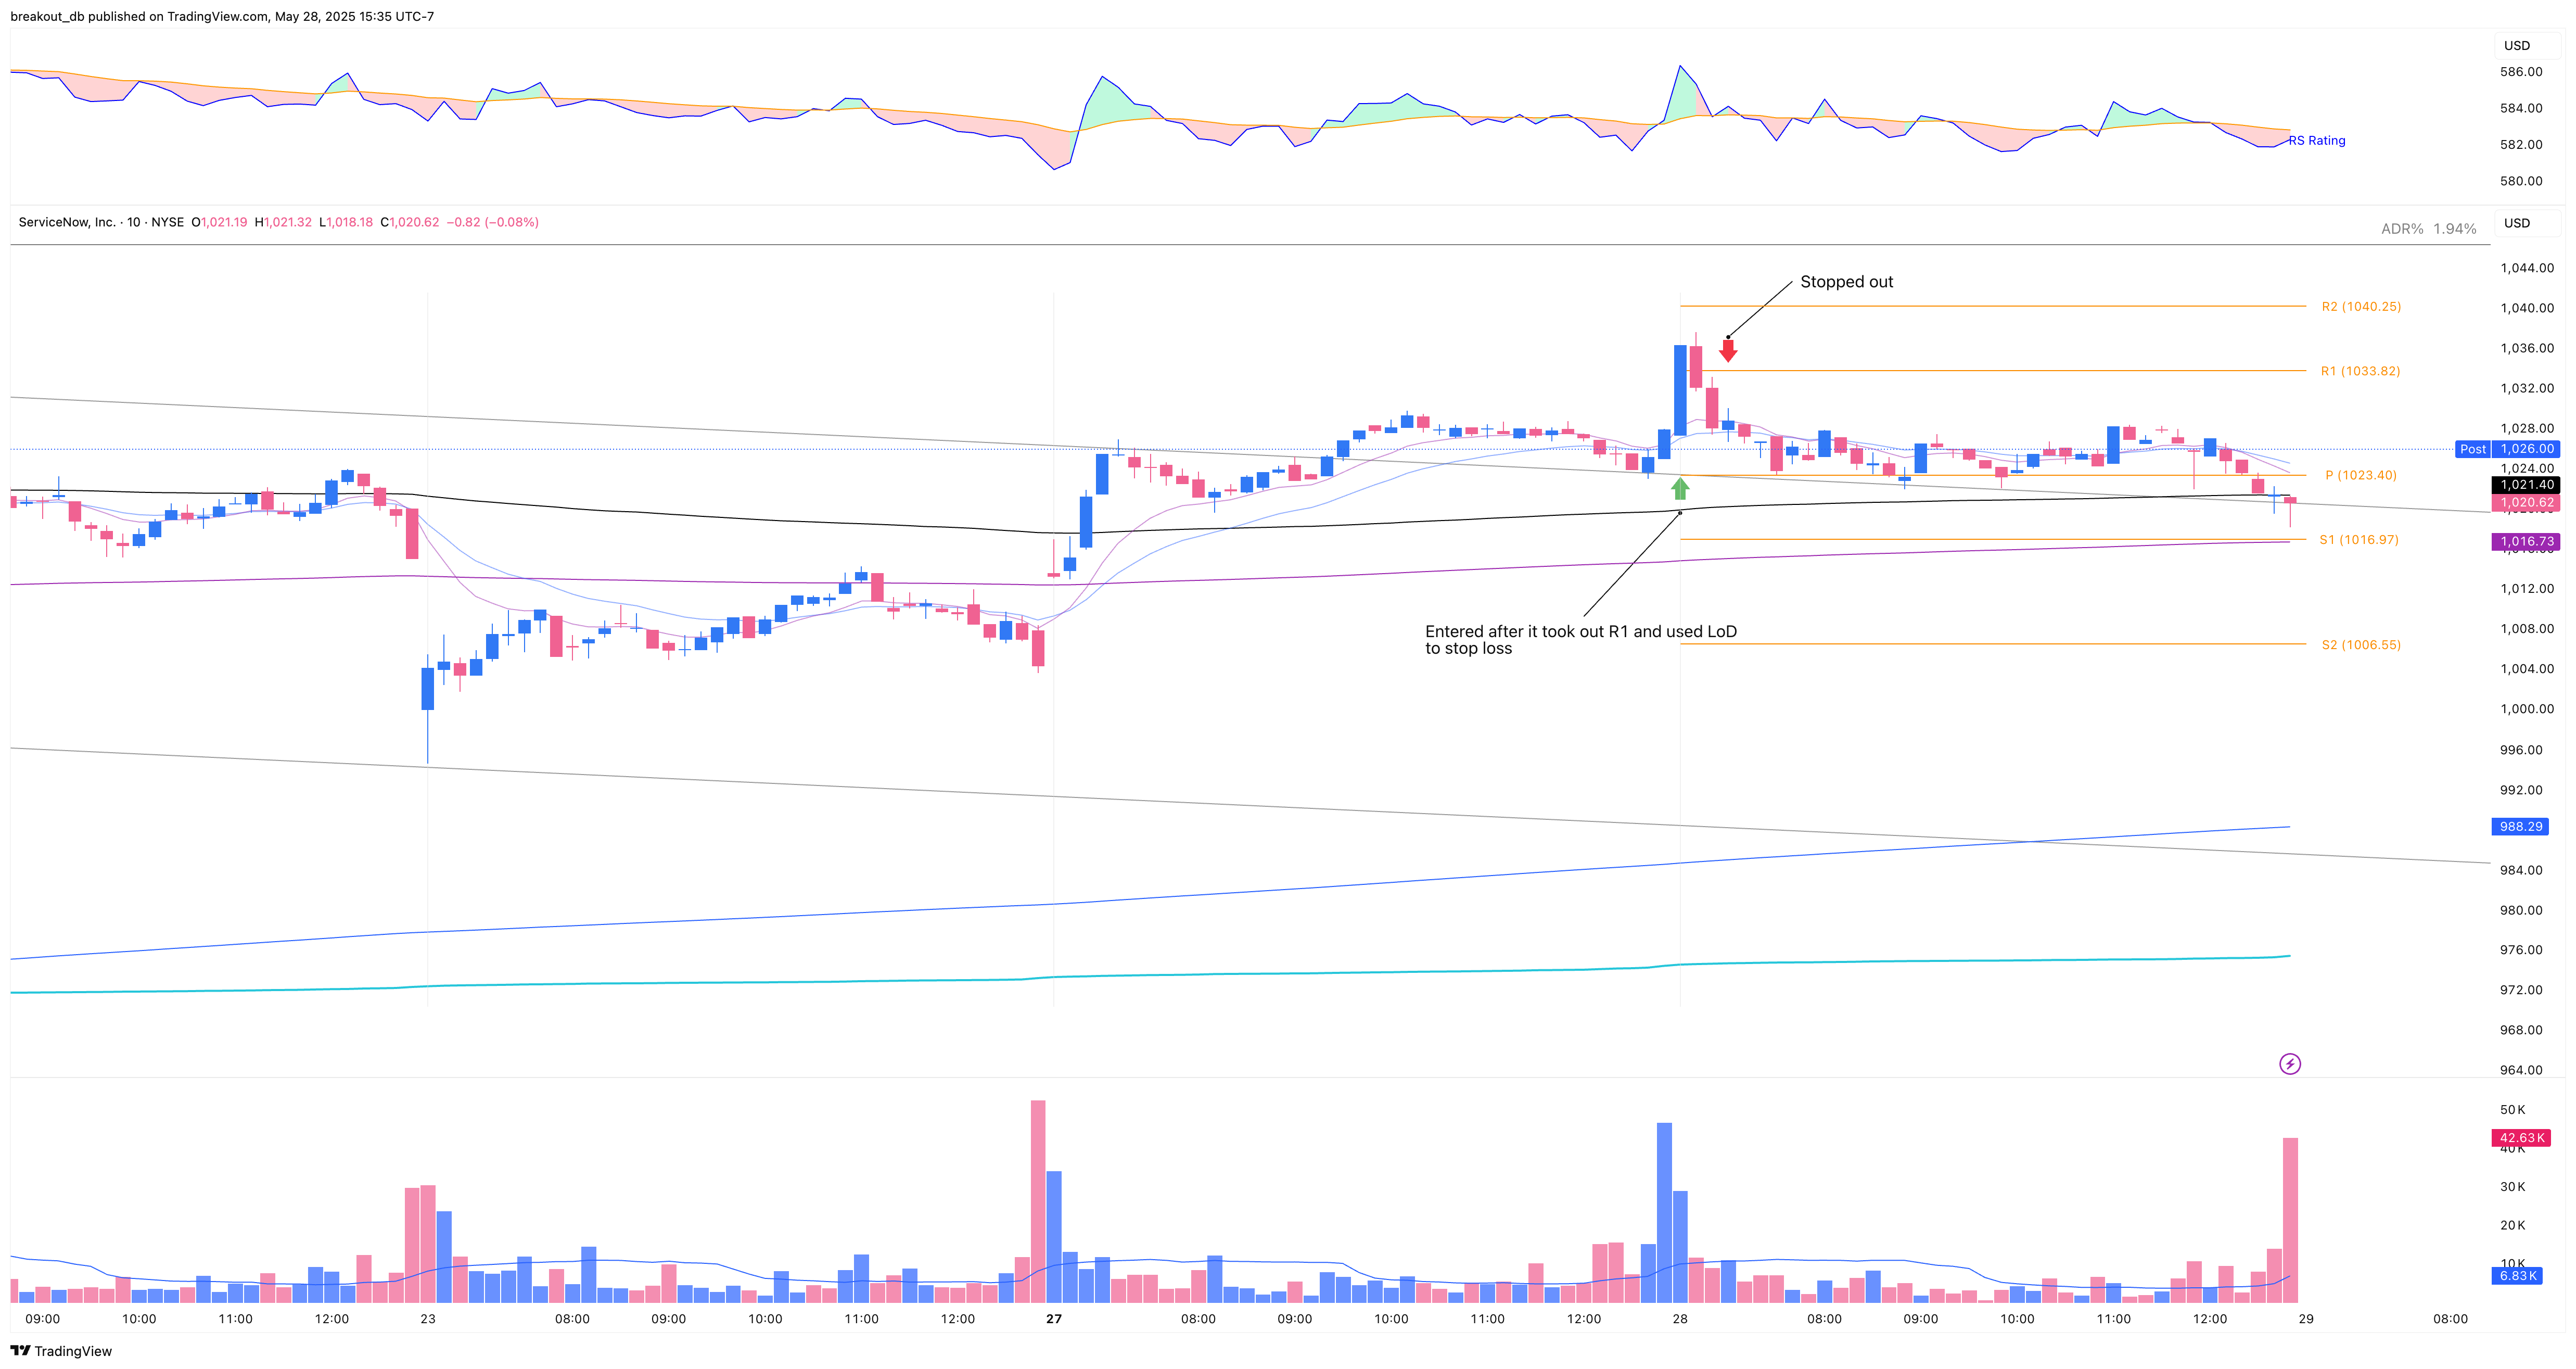
On the morning of May 28th, 2025, the stock broke out of its downward channel with strength but quickly lost momentum. If you, like me, traded the earnings breakout using the low of the day as your stop, you likely got stopped out with about a 1% loss.
This stock has a unique personality and tends to reward pullback entries more than breakout trades. Personally, I haven’t had a successful trade with it yet — which is frustrating.
Intraday Entry

After Breakout
