TSLA - High Tight Flag - 2021-01-25
TSLA Trade Summary
Performance metrics and trade details for TSLA breakout.
- About
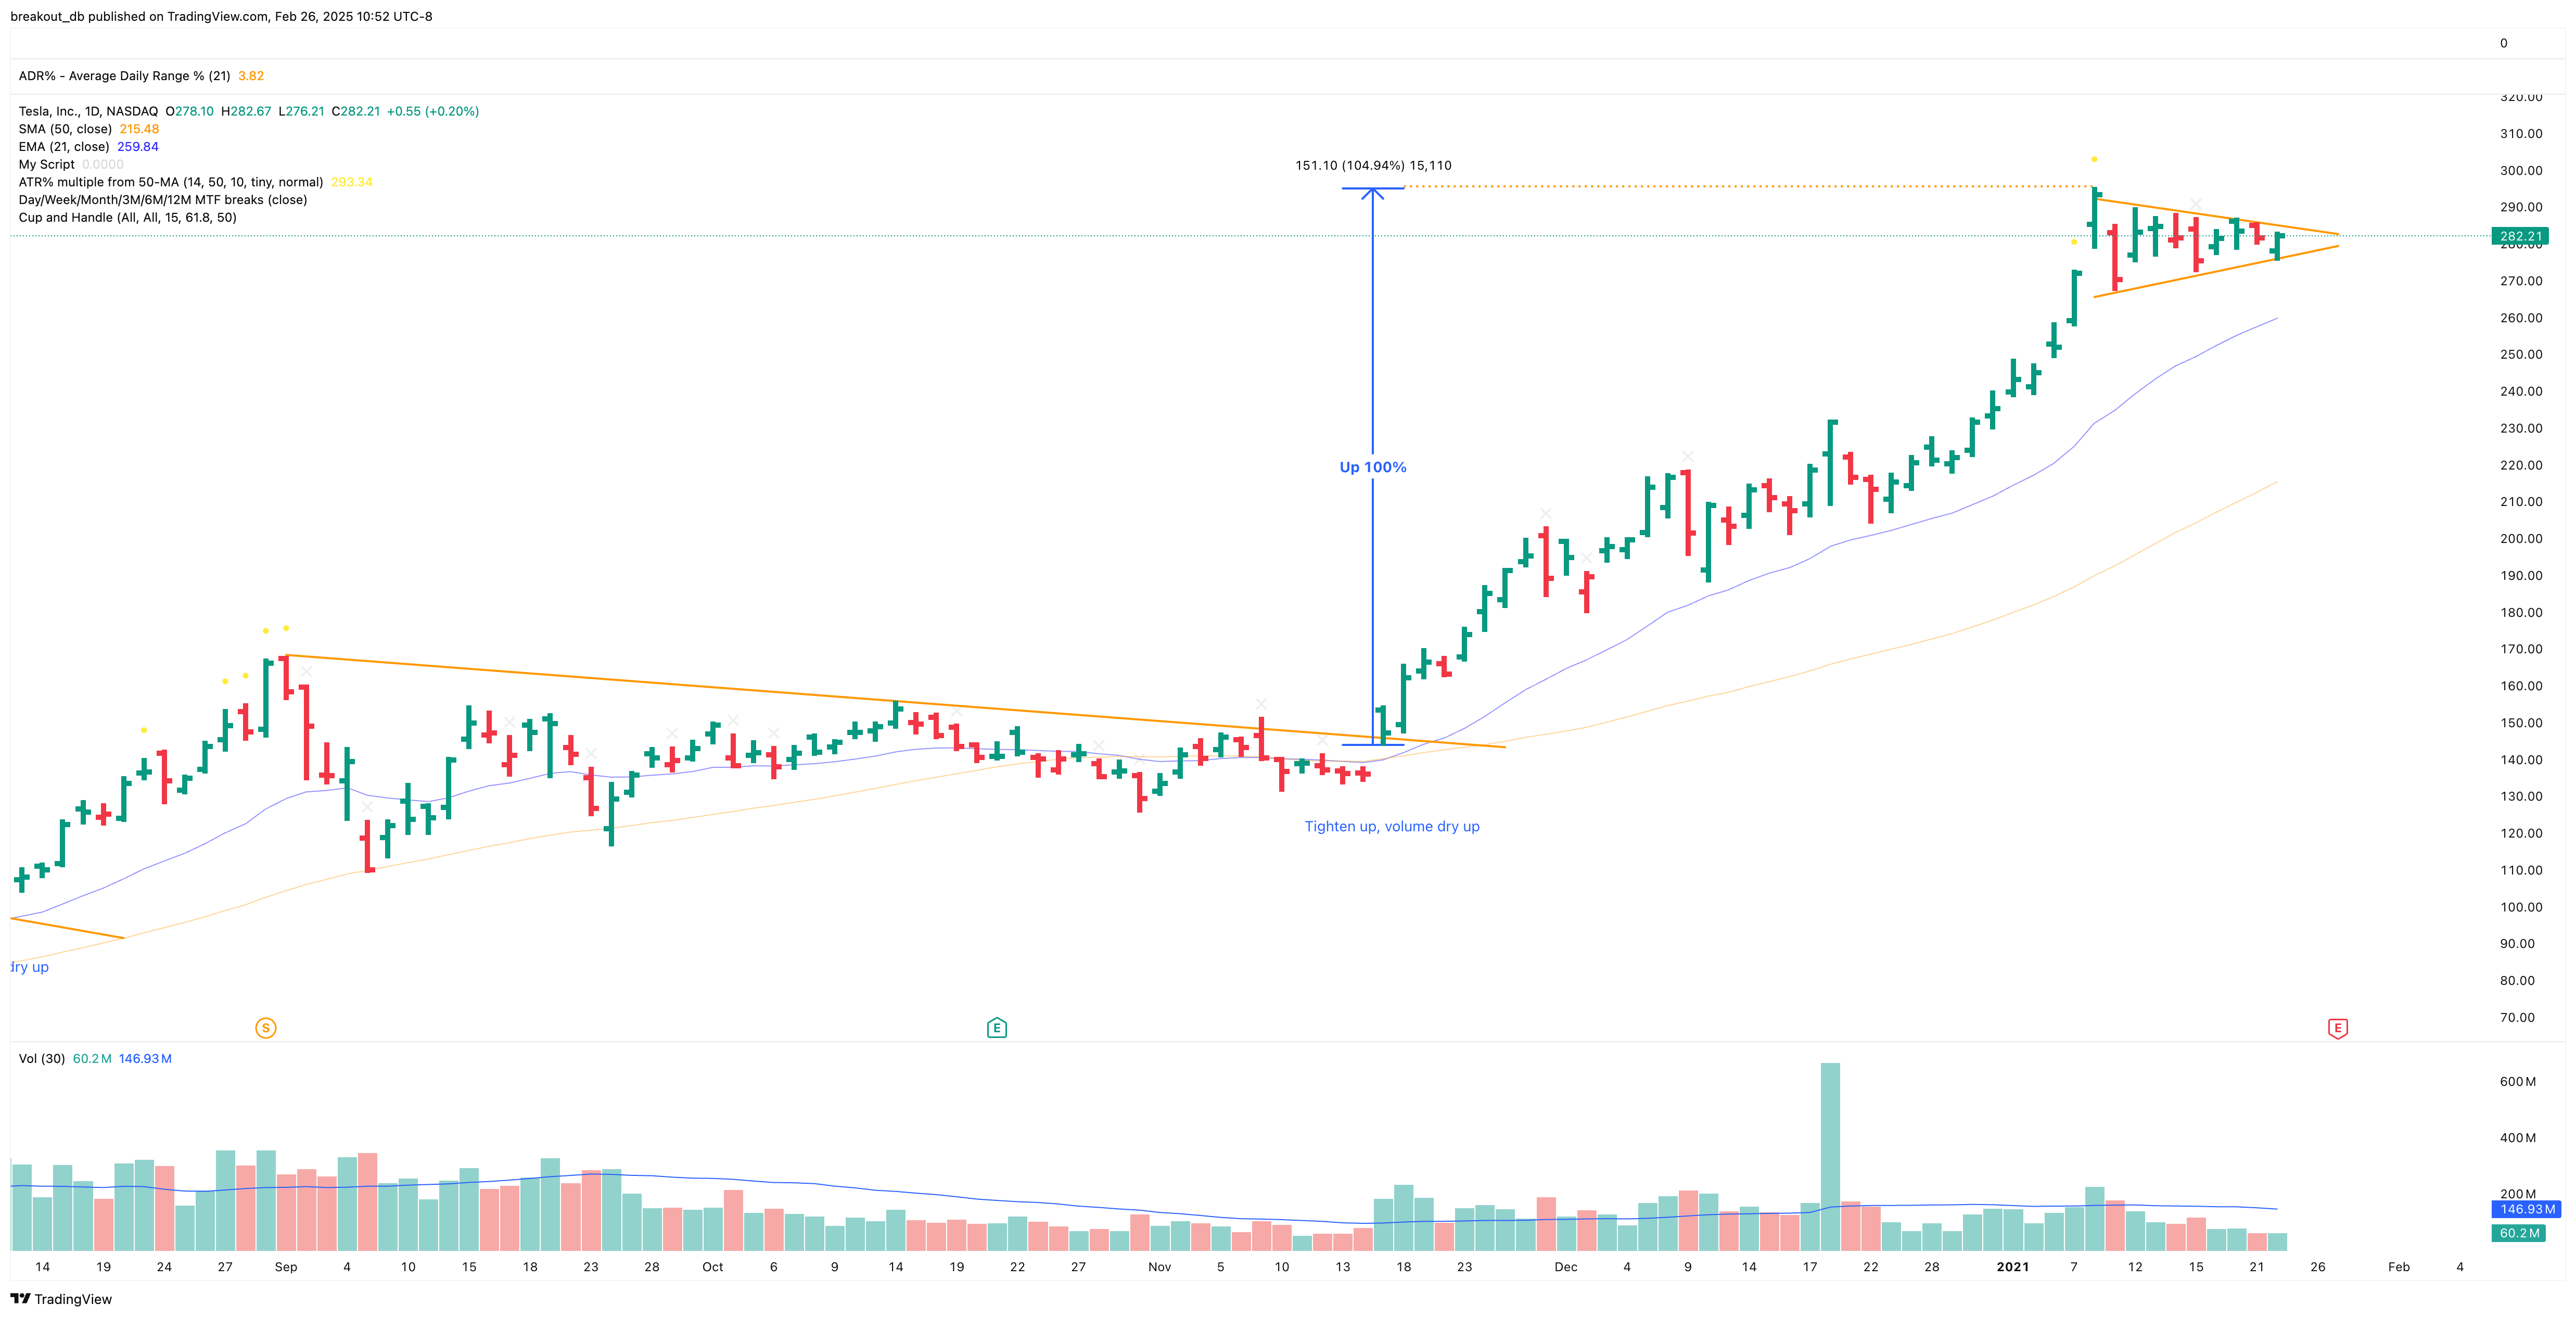
TSLA surged 100% from a previous bull pennant setup before moving sideways and forming a tight 2-week pennant.
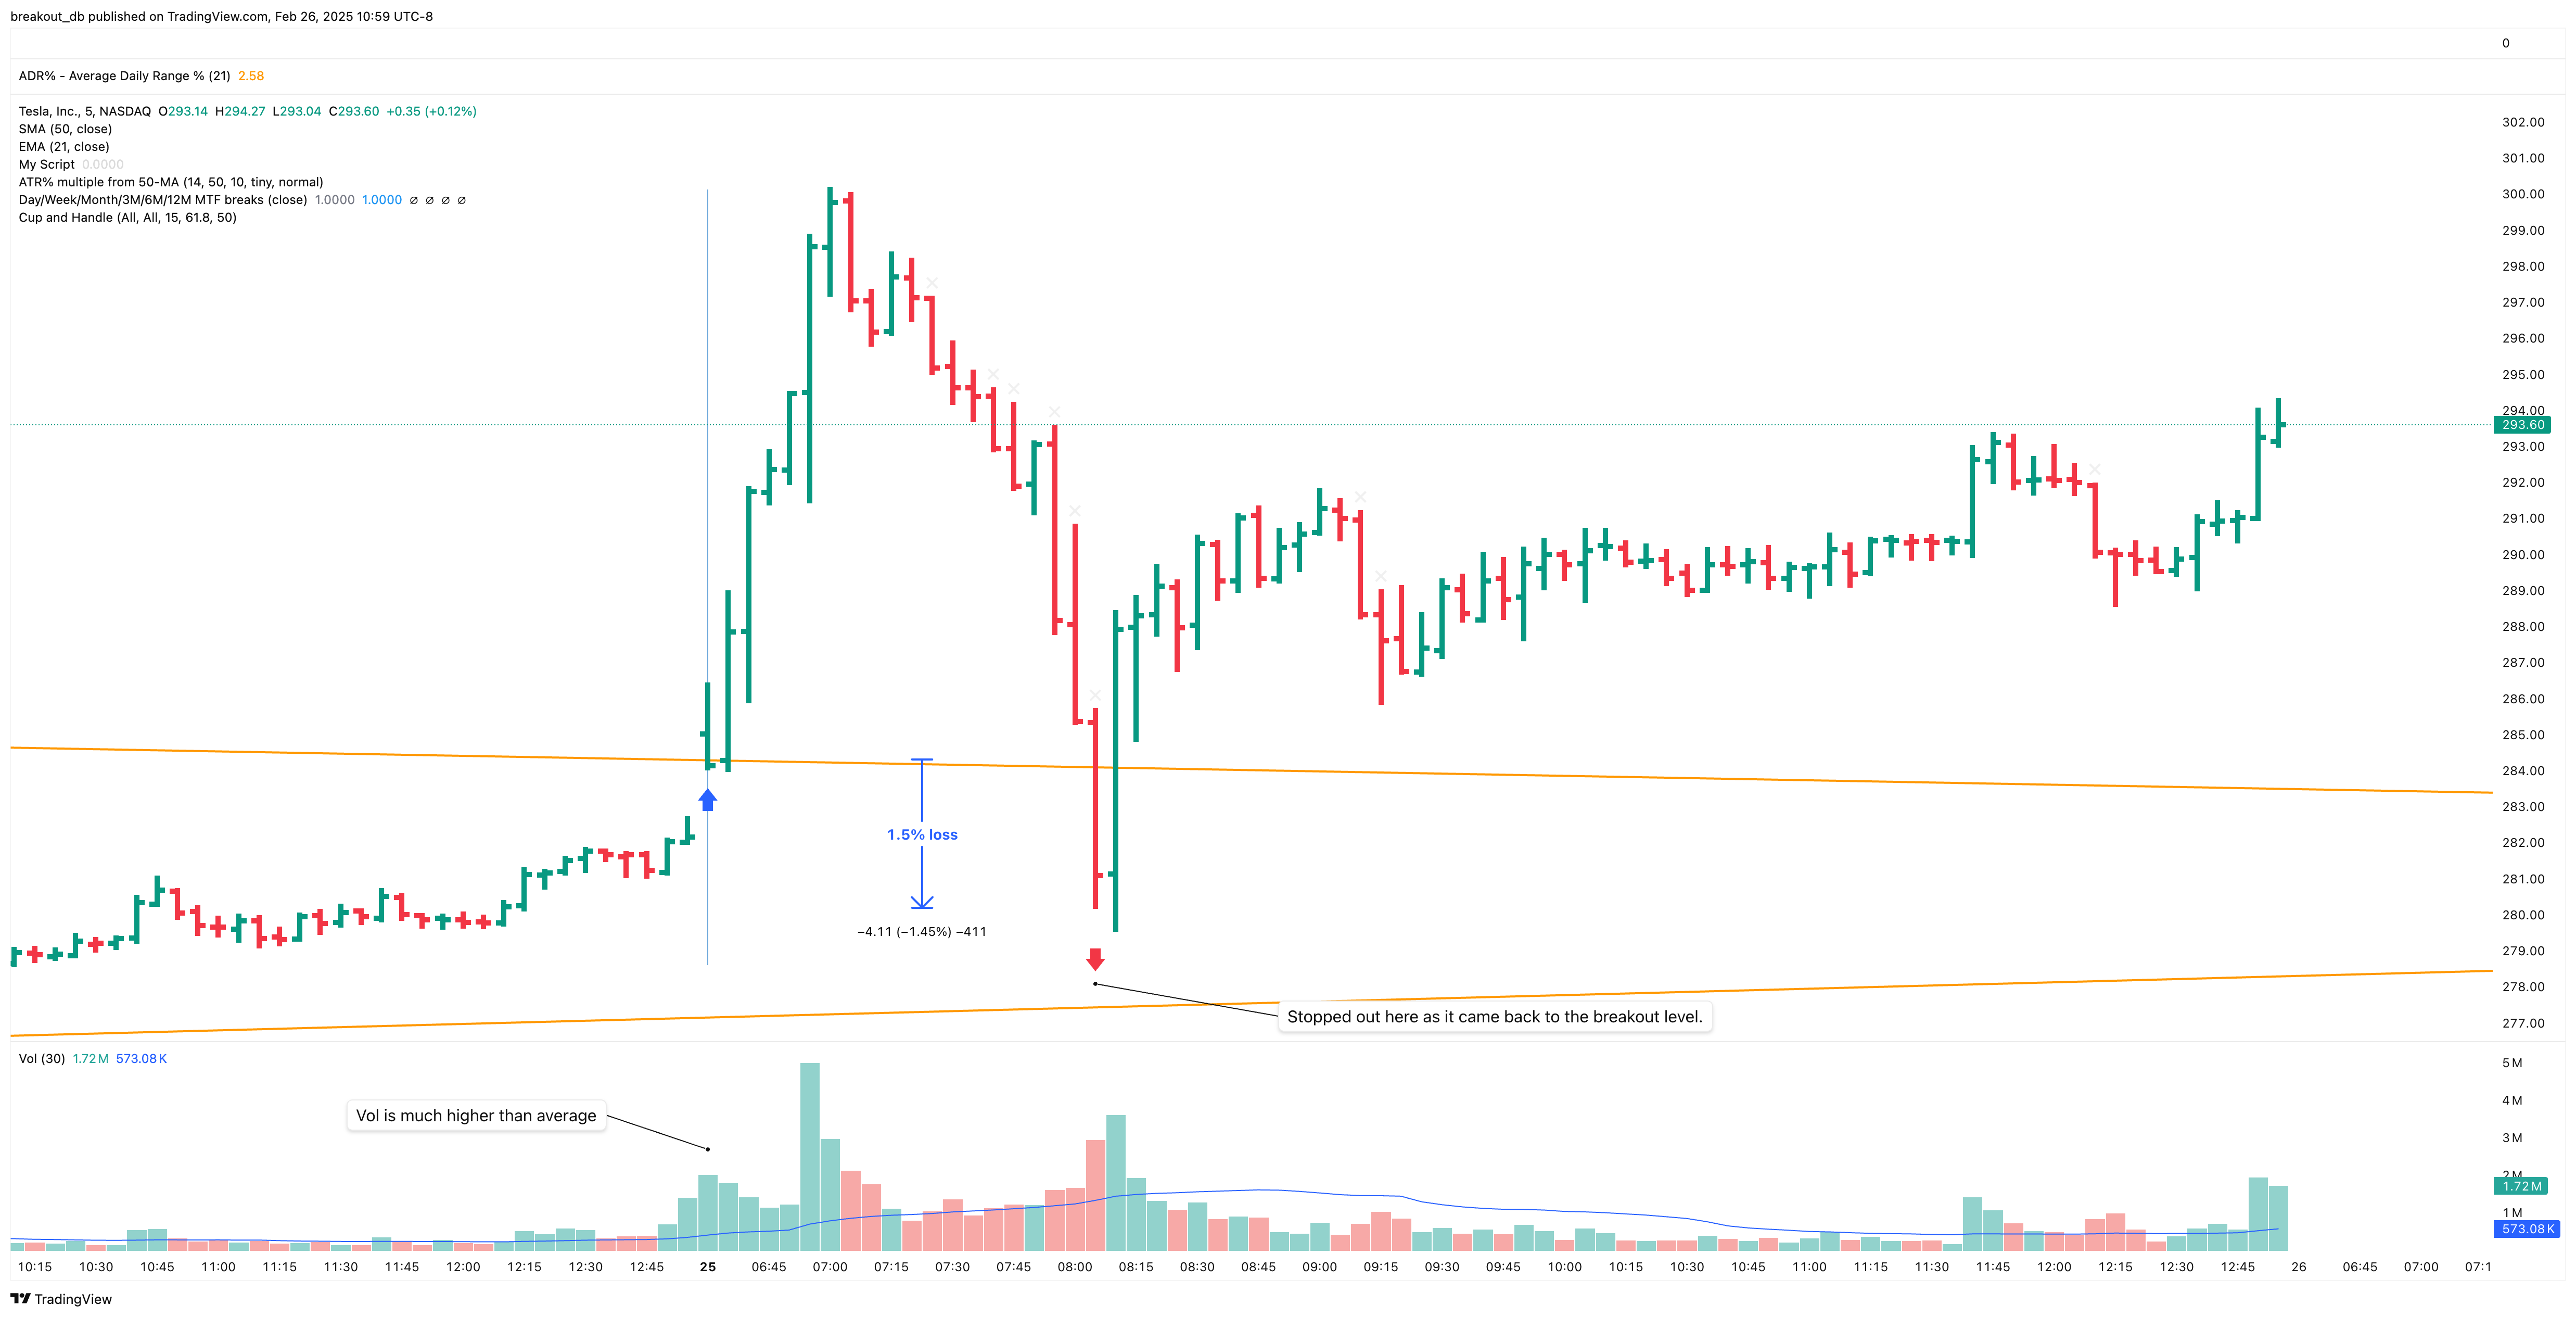
On Jan 25, 2021, TSLA gapped up at the open and broke out of the pennant with above-average volume.
If we entered at the breakout level using the upper pennant line as a stop, we would have been stopped out the same day with a small, negligible loss. The same applies to using LoD and entering at the 5-min ORH.
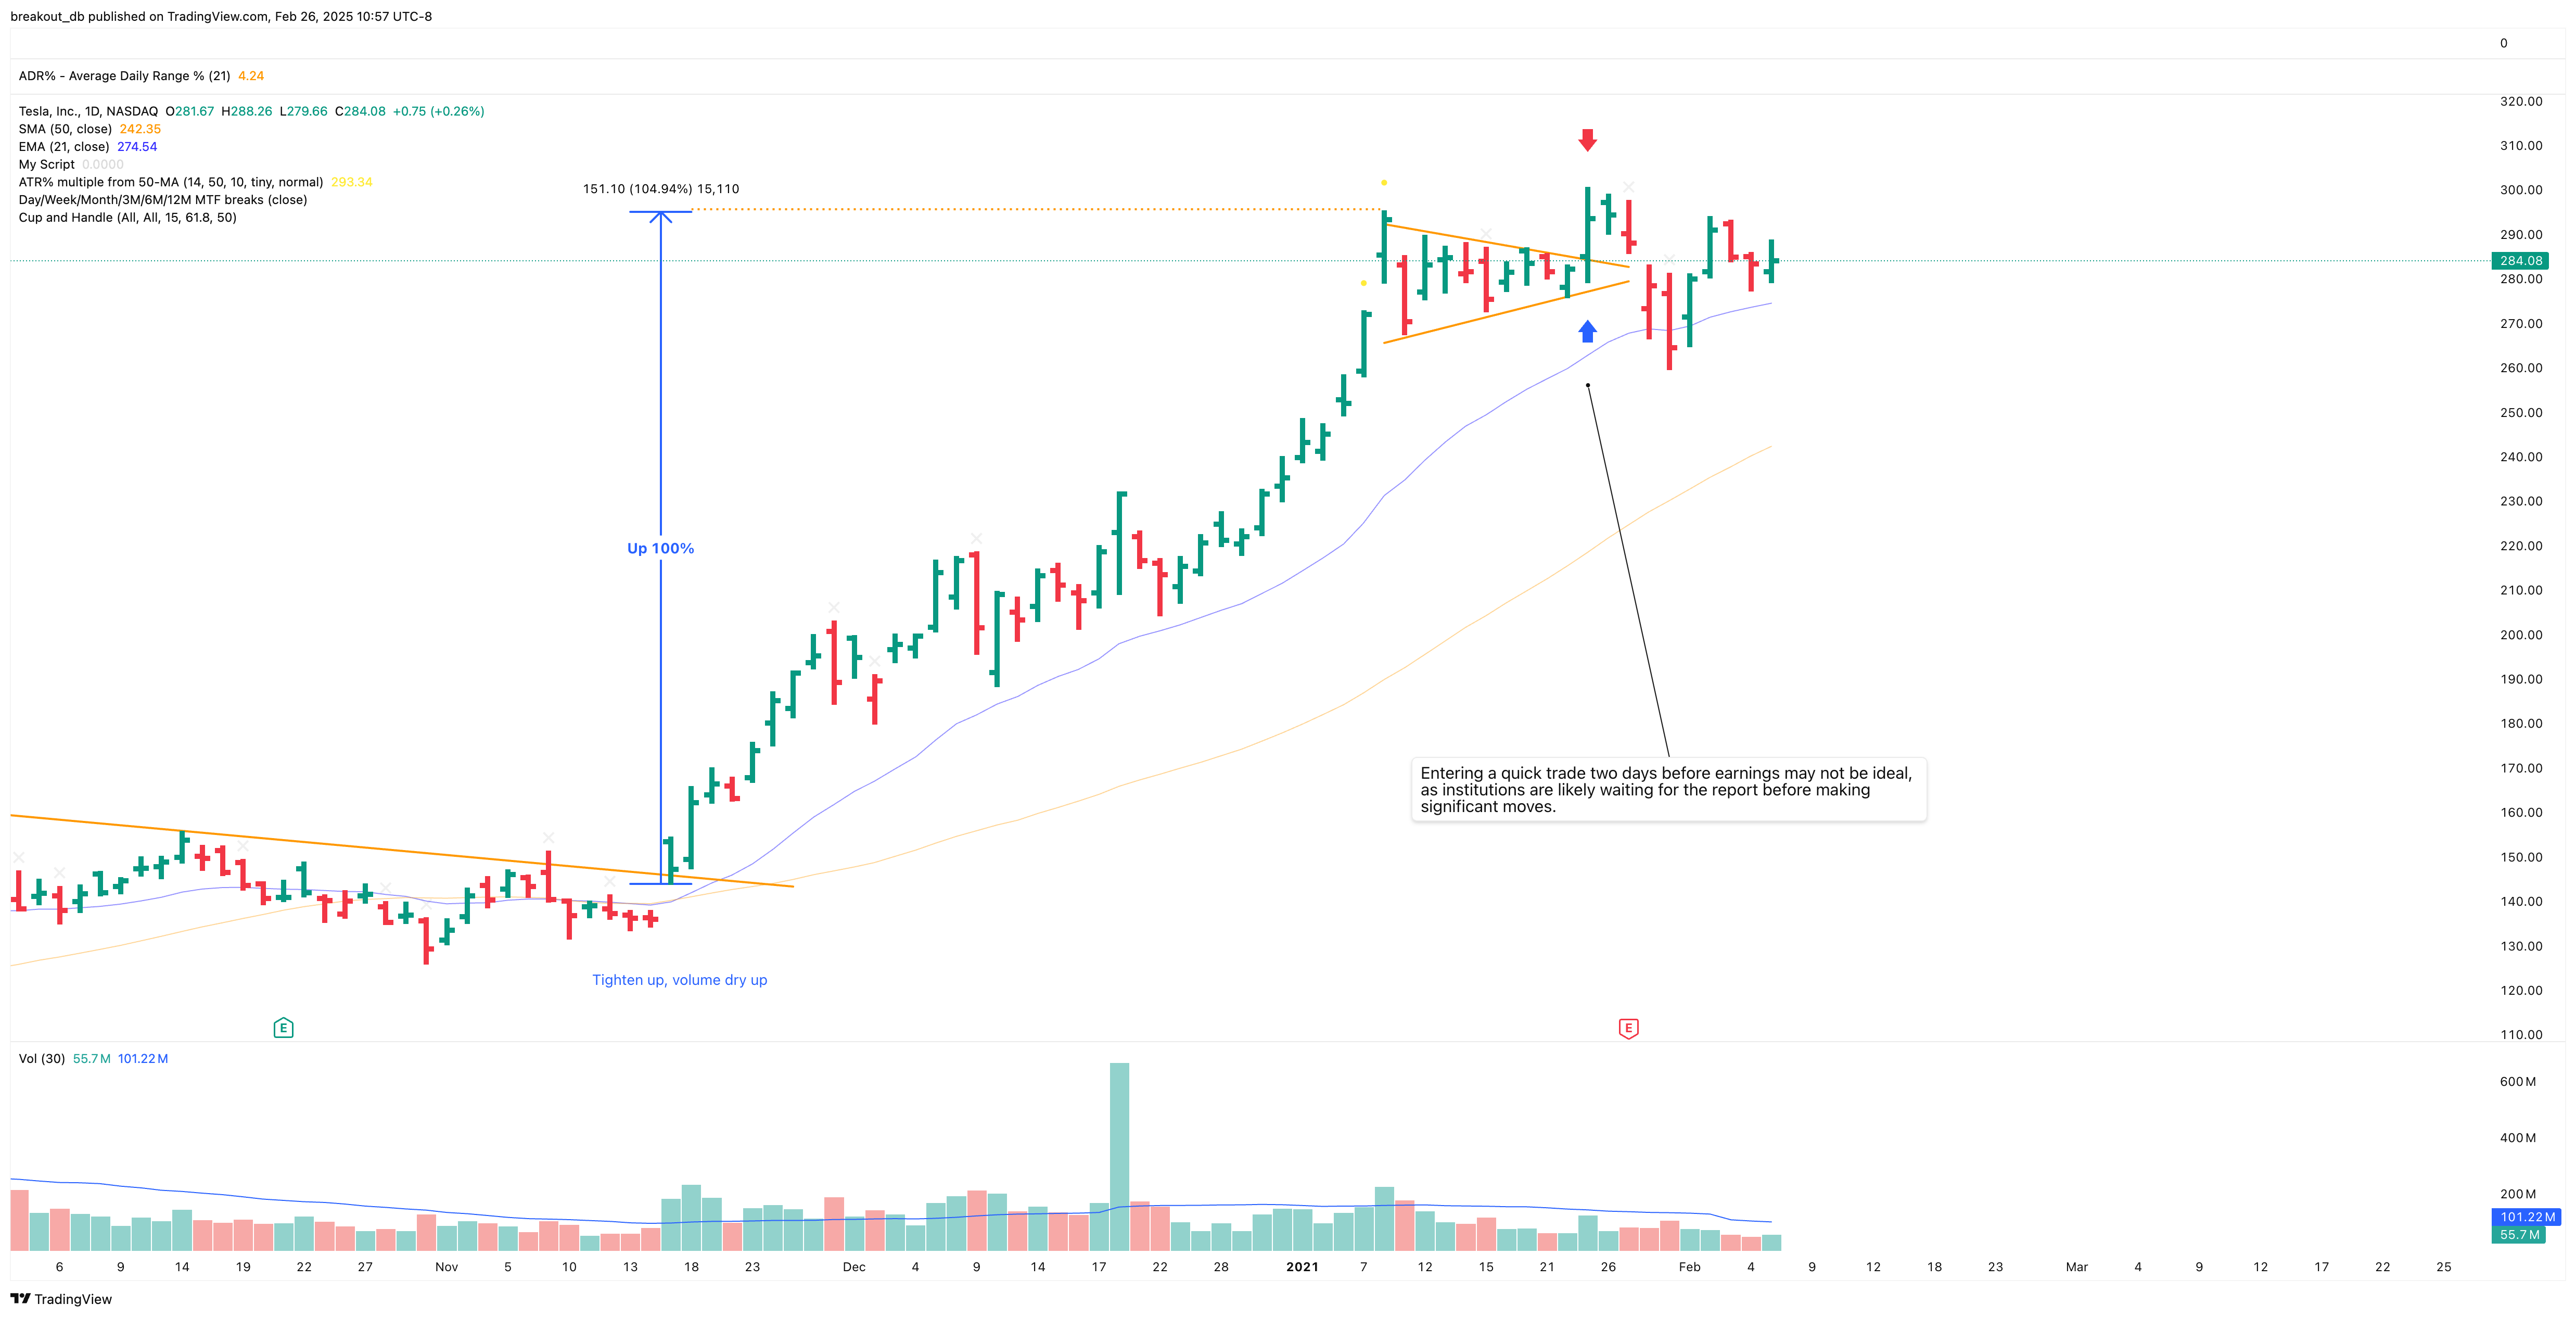
Zooming out on the daily chart, the breakout day’s volume was actually below average, suggesting weakness. Even with a wider stop loss, we would have likely exited by the close.
TSLA continued sideways and pulled back in the following days.
Also note: Jan 25 was just two days before earnings, making it a risky entry. A quick trade before an earnings report is best avoided.
Learning: Entering a quick trade two days before earnings may not be ideal, as institutions are likely waiting for the report before making significant moves.
Before Breakout Daily

Intraday Entry

After Breakout
