ZS - High Tight Flag - 2021-01-08
ZS Trade Summary
Performance metrics and trade details for ZS breakout.
- About
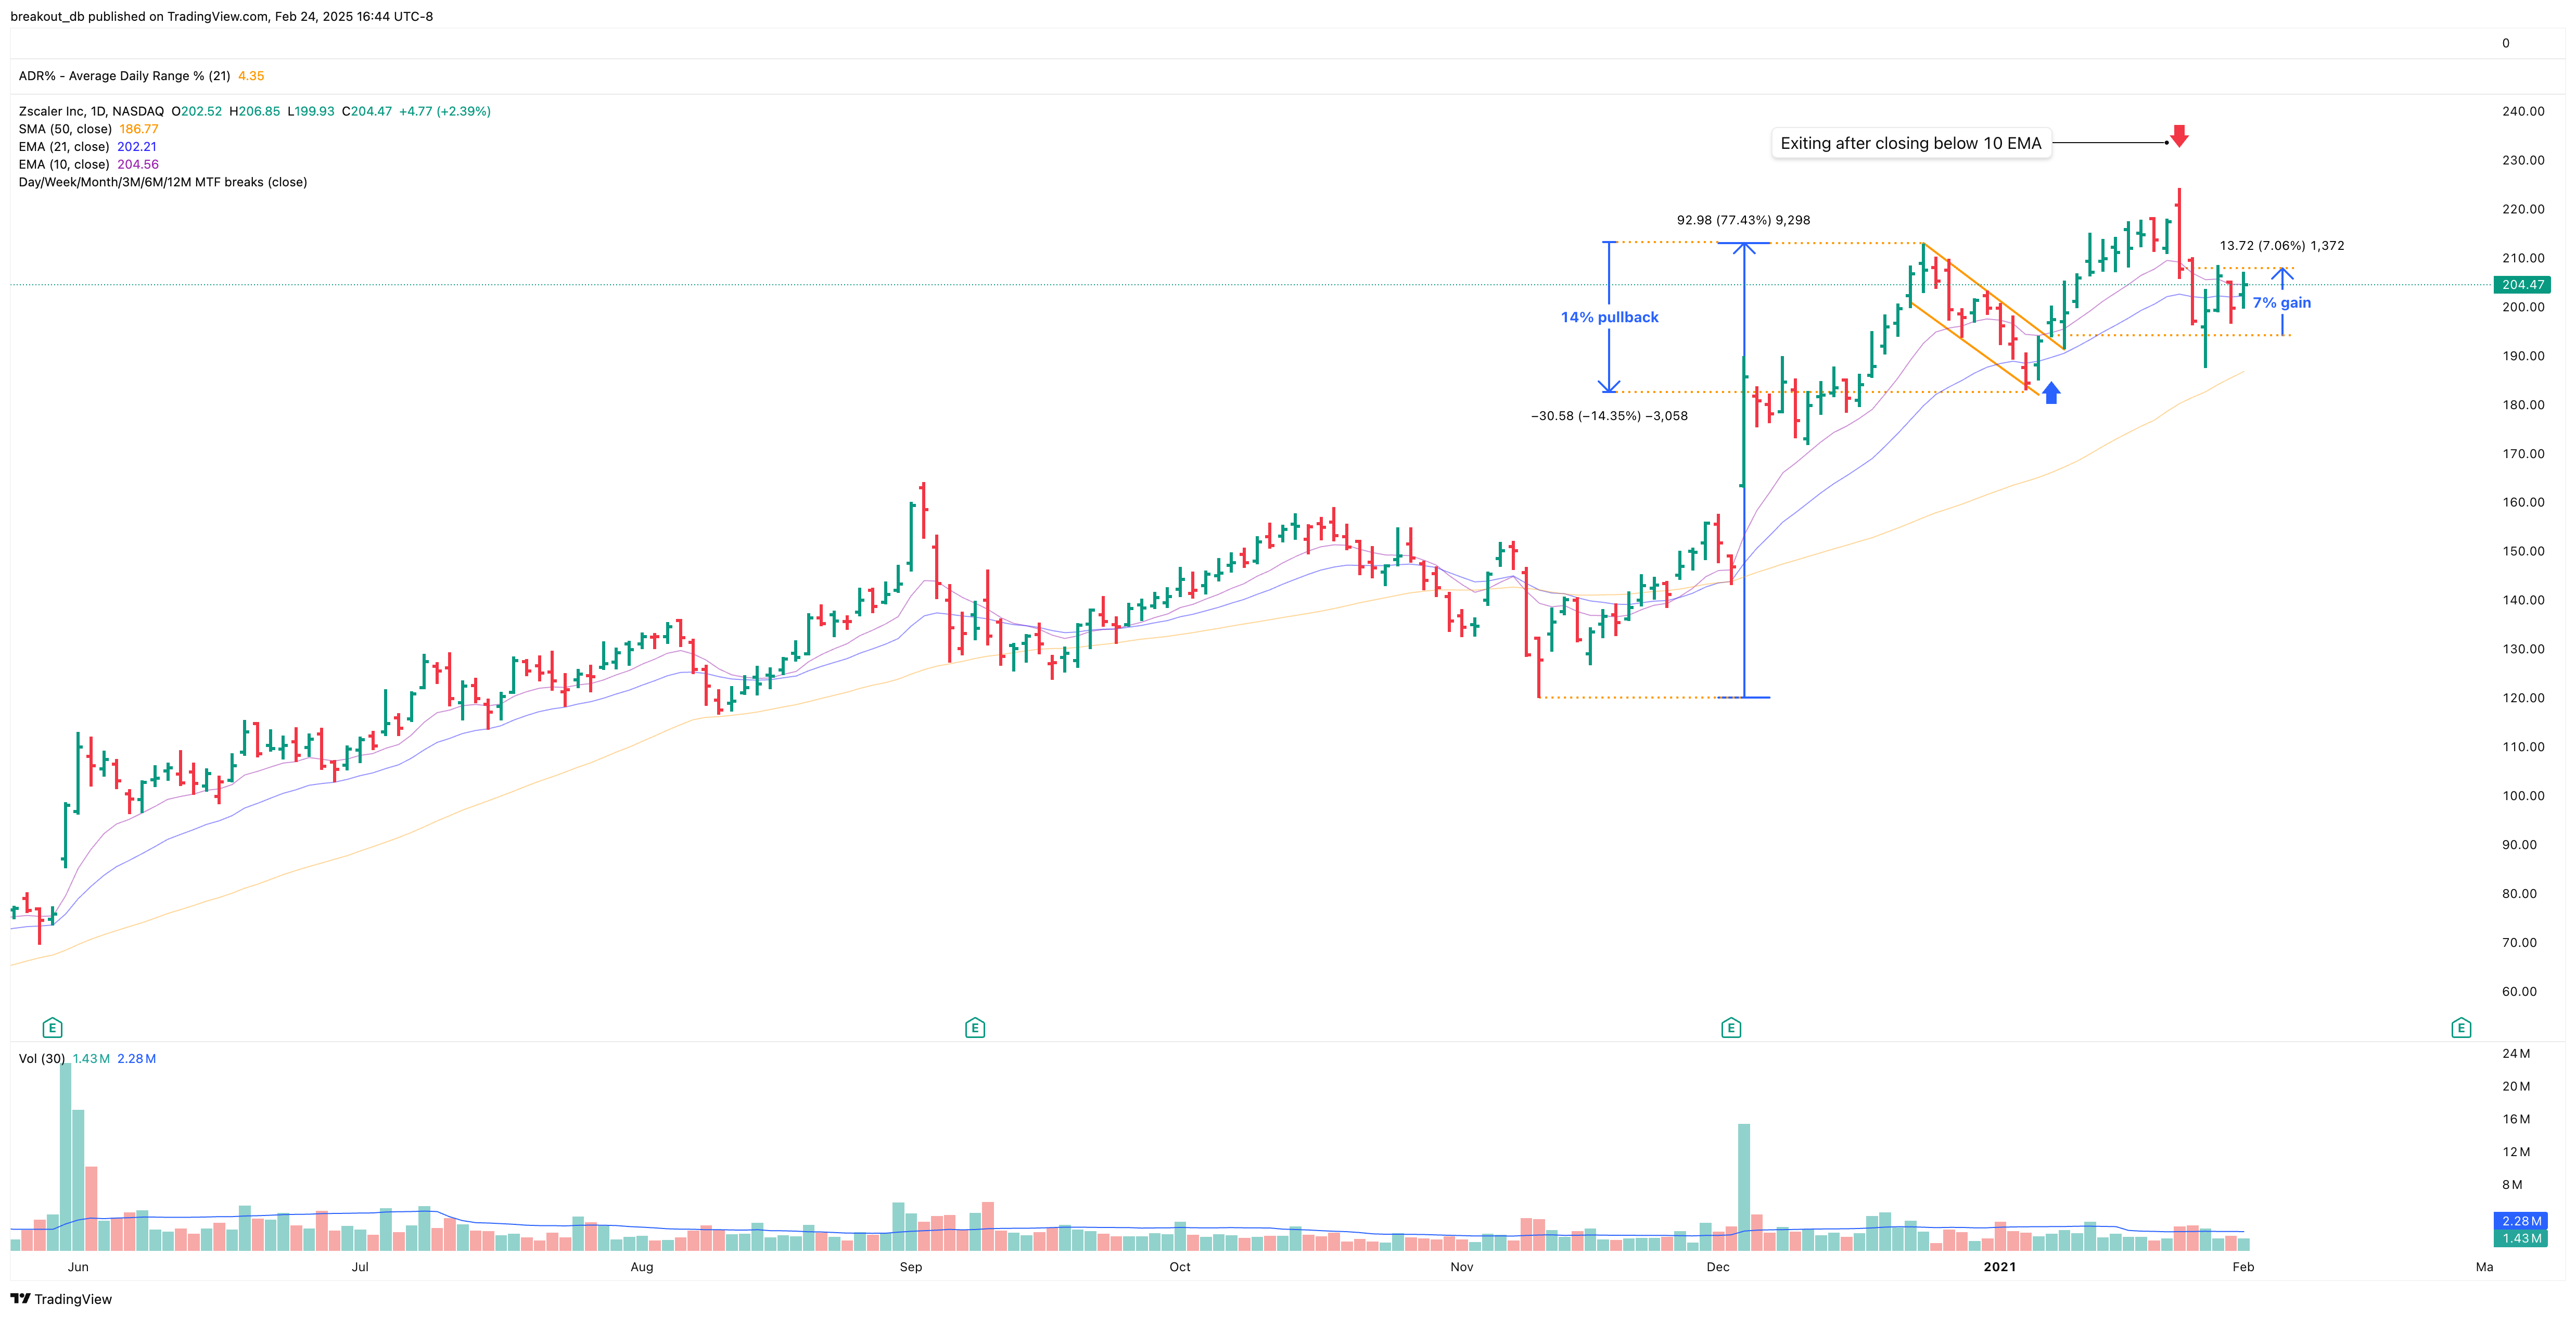
Zscaler Bull Flag Trade:
- Initial Surge: Rallied 77% from the bottom.
- Pullback: Formed a bull flag with a 14% decline over two weeks.
- Exit Signal: A bearish candle closed below the 10 EMA after two weeks, triggering an exit.
- Outcome: A 7% gain, which fell short of the 20% target for a successful trade.
While the setup was promising, the trade lacked strong follow-through, reinforcing the importance of managing expectations and adjusting strategies.
Before Breakout Daily

After Breakout
Market Correlation Analysis for ZS
Top Similar Tickers
Stocks that move in the same direction as ZS